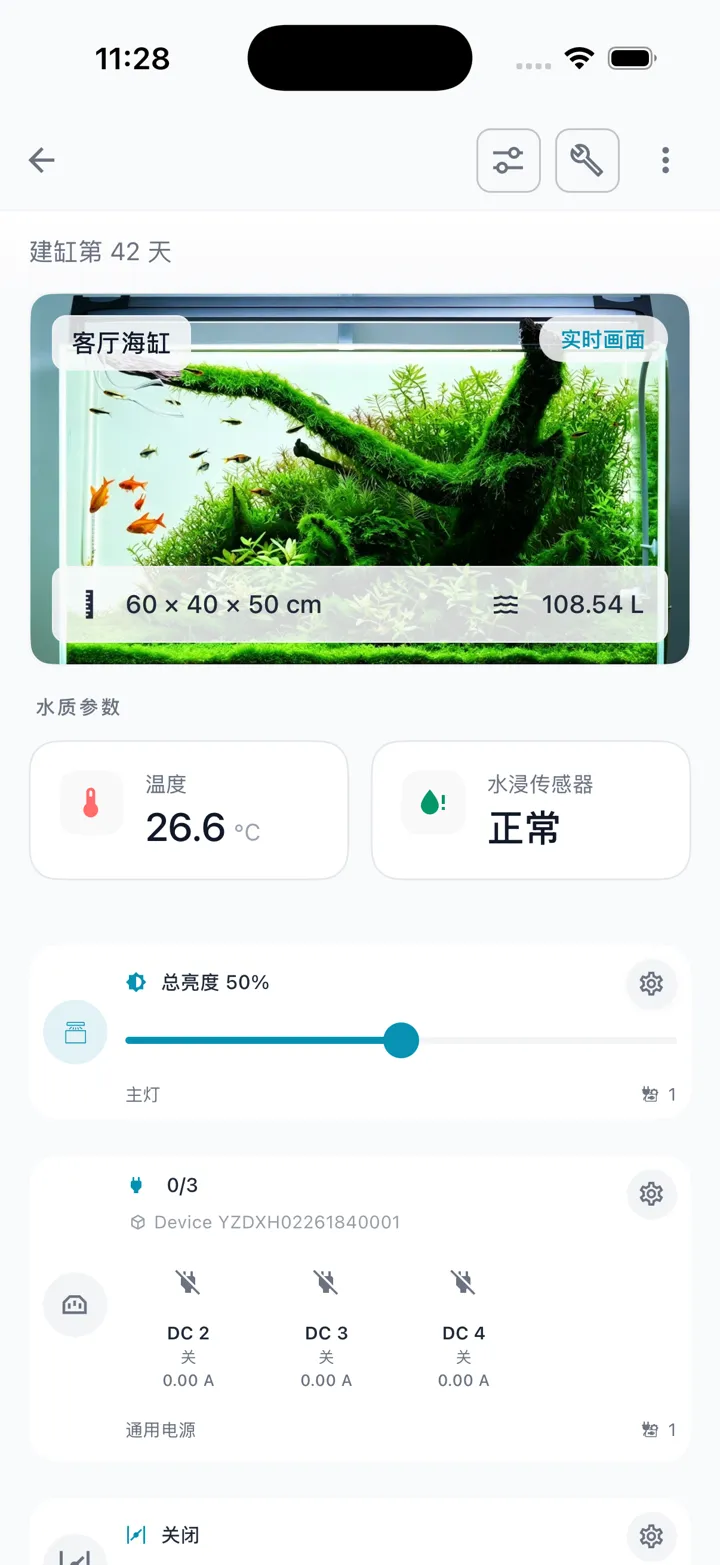
A tank's detail page is where you'll spend most of your time — viewing data, controlling devices, checking history, and doing maintenance all happen here.
The tank detail page roughly has: a cover photo + days-since-setup at the top; a "Maintenance" (wrench) and menu (⋮) button at top right; live water-quality metric cards; quick actions (one-tap light on/off, etc.); per-device cards (grouped by main light, pump, etc., controllable directly); automation (this tank's scheduled/conditional rules — see Automation); and entries for operation logs and alerts.
💡 These "long-press" actions are easy to miss — note them:- Long-press the cover photo → change the cover;- Long-press the pump icon (when on, normal state) → set a feeding duration and start feeding mode;- In light detail, long-press a preset slot → save / edit that preset;- Long-press an operation-log entry → menu to edit / delete;- Long-press an alert → menu to acknowledge / delete;- Long-press an automation card → edit / share / preview / delete. >Also, list pages (home, devices, alerts) all support pull-to-refresh.
Reading the dashboard (live values & health)
The live metric cards at the top of the tank detail page show whichever sensors you've bound — commonly temperature, pH, water level, salinity, dissolved oxygen, TDS, flow, humidity, etc. Each card is icon + name + value + unit, refreshing live when the device is online.
- When there's no reading or no matching sensor bound, the metric card shows "-"; when the device is offline, the value stays at the last reading. ("Not bound / Bind device" appears on the per-device binding rows below, not on this row of metric cards.)
- Health color: if you set a target range for temperature / pH (a target value + safe upper/lower limits), the system judges whether the reading is healthy and shows a color hint on the home tank card — default = normal, yellow = off target, red = past the safe limits. The detail page itself only shows values; the health color is on the home card.
💡 Health ranges are computed from the targets/limits you configure, not a built-in universal standard. With no range configured, only the value is shown — no health judgment.
Controlling devices
What you can do per device type:
Device | What you can do |
|---|---|
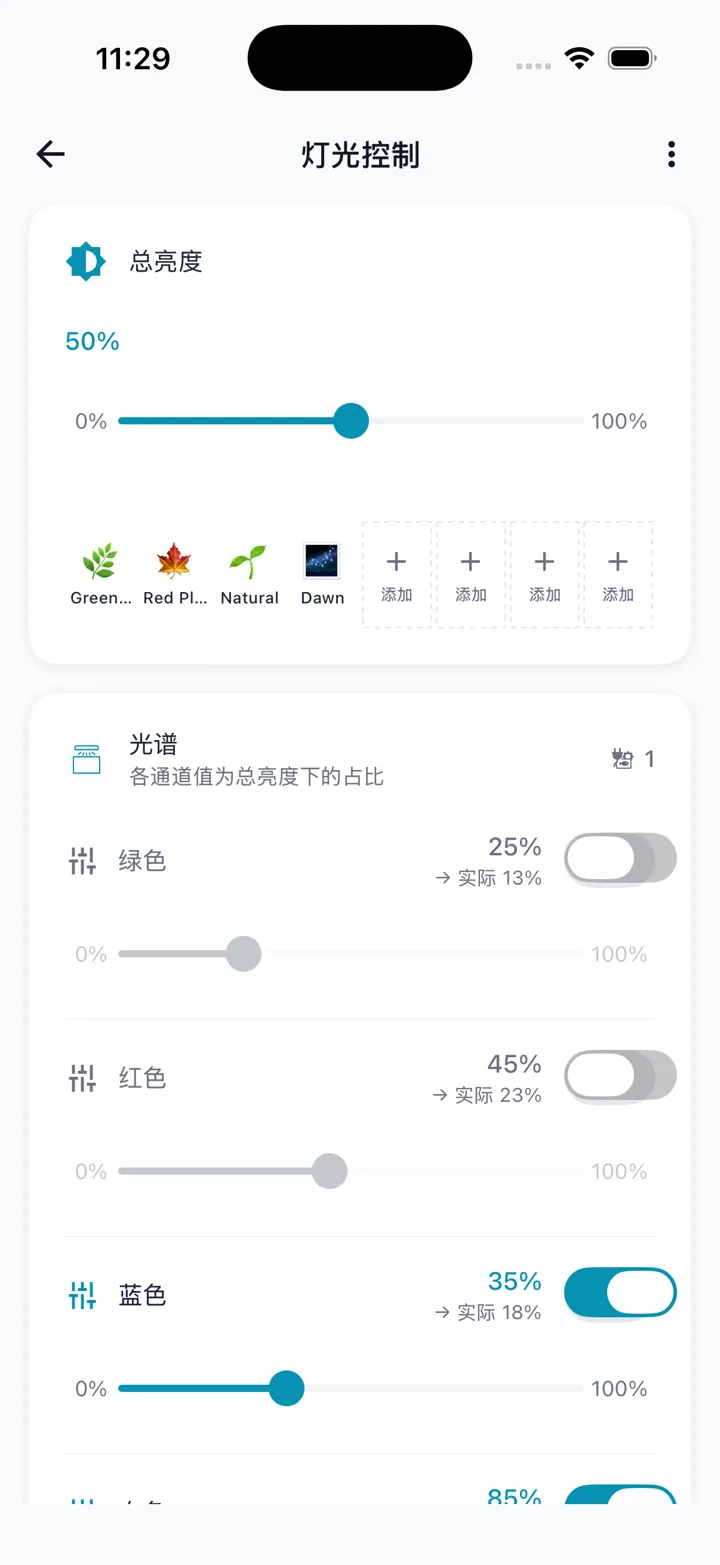
Lighting | On/off, overall brightness, per-channel spectrum, apply presets; you can also save a tuned spectrum and generate a share code for a friend, who applies it in one tap via "Import by code" on their light detail. Gestures: in the preset area, tap a slot = apply that preset; long-press a slot = save / edit the current spectrum into it. |
Pump | On/off, adjust power, view live power and history; supports feeding mode (temporarily pause the pump while feeding so food isn't sucked away, auto-resuming when time's up). Gesture: when the pump is on and in its normal state, long-press the pump icon = open the set-feeding-duration dialog; confirm to start feeding mode. |
Air pump | On/off, adjust power (running/stopped state at a glance). |
Sensor | View live readings (water temp, water level, pH, etc.), check history charts and the data table; level/temperature types also support calibration. |
Dosing pump | Dose manually, set each channel's dose and rate, view dosing history. |
Universal power strip | Multiple ports switch independently, each shows live current, and you can assign a purpose to a port. |
💡 When a device is offline or off, adjustment actions are blocked with a reason (e.g. "Device offline, please check the connection") — get it online/on first.
Want these devices to run automatically (lights on schedule, cool down when it gets warm…)? See Automation.
Viewing history charts (telemetry history)
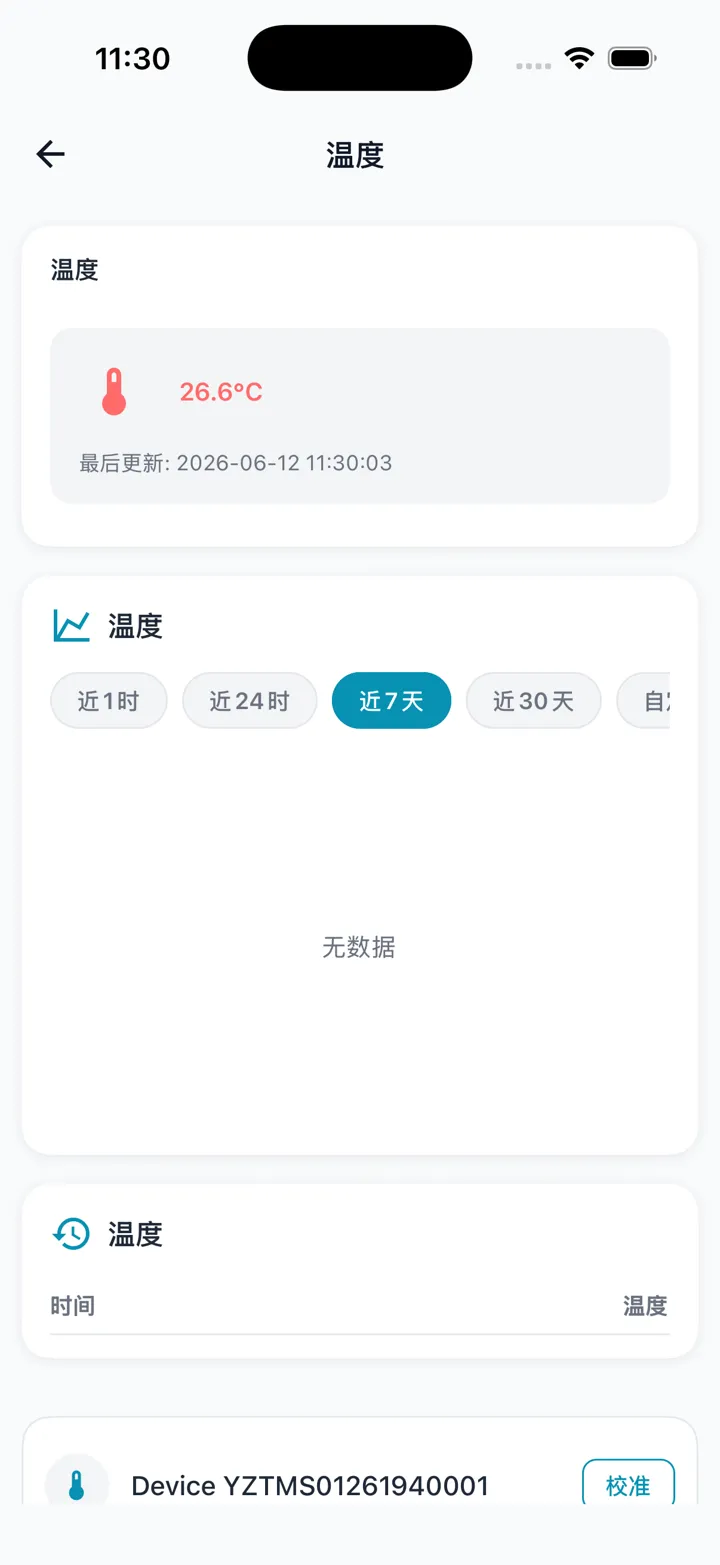
Want to see trends for temperature / water level? Open a sensor or pump detail page and scroll down to the "History" section: a line chart + a history data table.
- The time range is a row of always-on buttons — tap to query instantly: Last 1 hour / Last 24 hours / Last 7 days (default) / Last 30 days / Custom.
- Choose "Custom" to pick a start / end time, but a single query is at most 30 days — beyond that it warns "Range cannot exceed 30 days"; the calendar goes back about 1 year.
- With many data points the chart auto-downsamples while keeping its shape (no lag); the table shows the most recent few by default — tap "View all" for more.
Maintenance mode (pause automation while changing/cleaning)
When changing water, cleaning, or servicing, automation (auto feeding, heating, top-off, etc.) can fire at the wrong time and get in the way. Maintenance mode temporarily pauses all of this tank's automation for a set time.
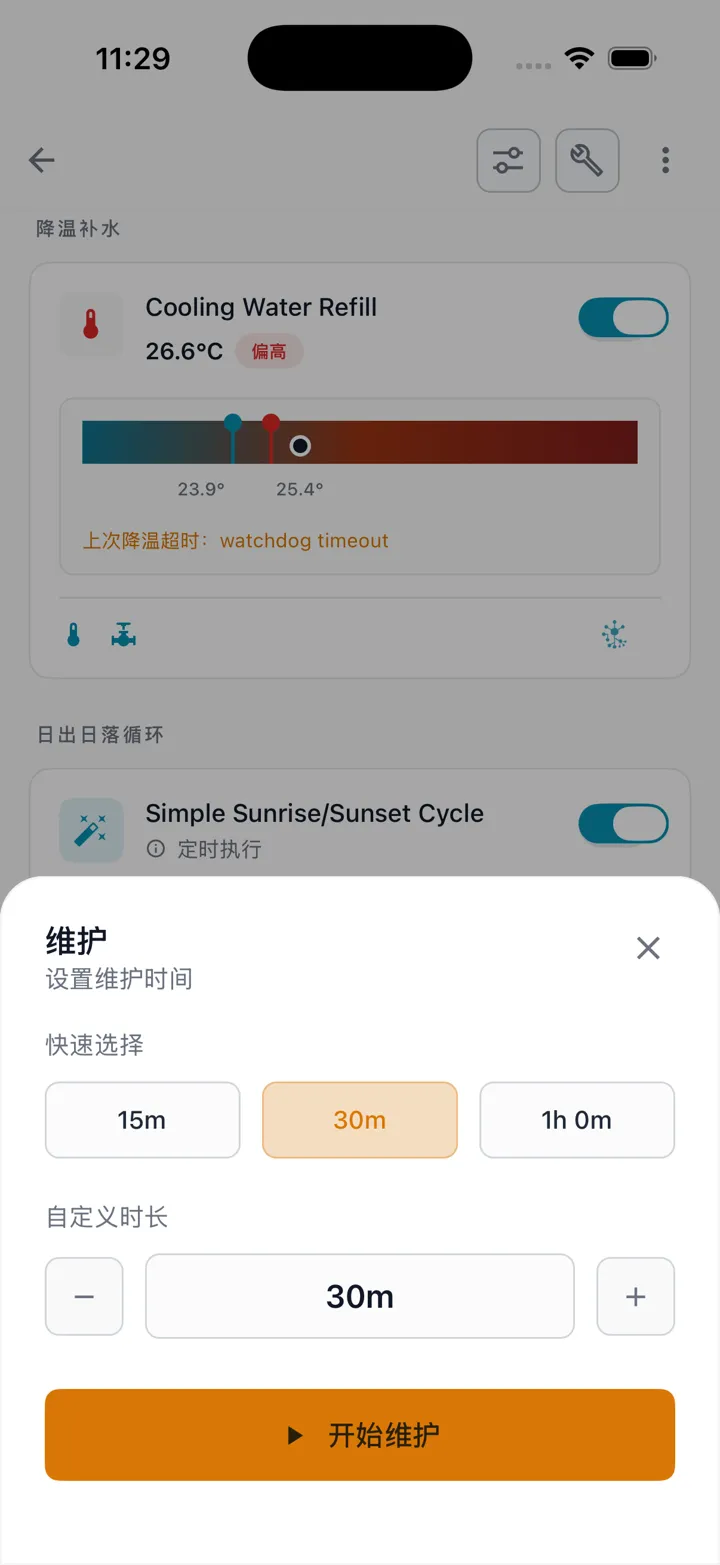
- Tap "Maintenance" (wrench icon) at the top right of the tank detail page.
- In the dialog choose a duration: quick-pick 15 / 30 (default) / 60 minutes, or use −/+ to customize (5-minute steps, up to 8 hours).
- Tap "Start maintenance". An orange banner + countdown bar appears at the top showing time left, during which all of this tank's automation is paused.
How it ends: it ends automatically when time's up and automation resumes; to end early, tap "Maintenance" → "Cancel maintenance"; if you need more time, tap "Extend 30 minutes".
Operation log (who · when · did what)
Want to know what's been done to this tank recently? Tank detail page menu (⋮) → Operation log.
- What's recorded: manual device on/off, automation triggering, adding/removing/enabling/disabling automation, mode changes, sensor calibration, system safety protection, etc. — all leave a trail.
- Defaults to the last 24 hours; the top can switch All / Last 24h / Last 7d / Last 30d / Custom; you can also filter by source (manual / automation / safety / system), type, and result.
- Two views: timeline (default, a vertical line grouped by day) and list (compact cards), toggled at top right, and your choice is remembered.
- Each entry shows: time, what happened (summary), a result badge (Sent / Applied / Failed / Skipped / Rejected / Running), and source · operator (e.g. "Manual · your username", "Automation · rule name"). Tap to see details (parameters, the full detail of this action).