YuzhaLab
Where aquatic knowledge becomes tested, documented, and turned into reliable systems.
YuzhaLab studies water quality, equipment behavior, automation logic, livestock care, and the way real aquatic environments actually behave — then turns what we learn into YuzhaLink products, solutions, and platform logic.
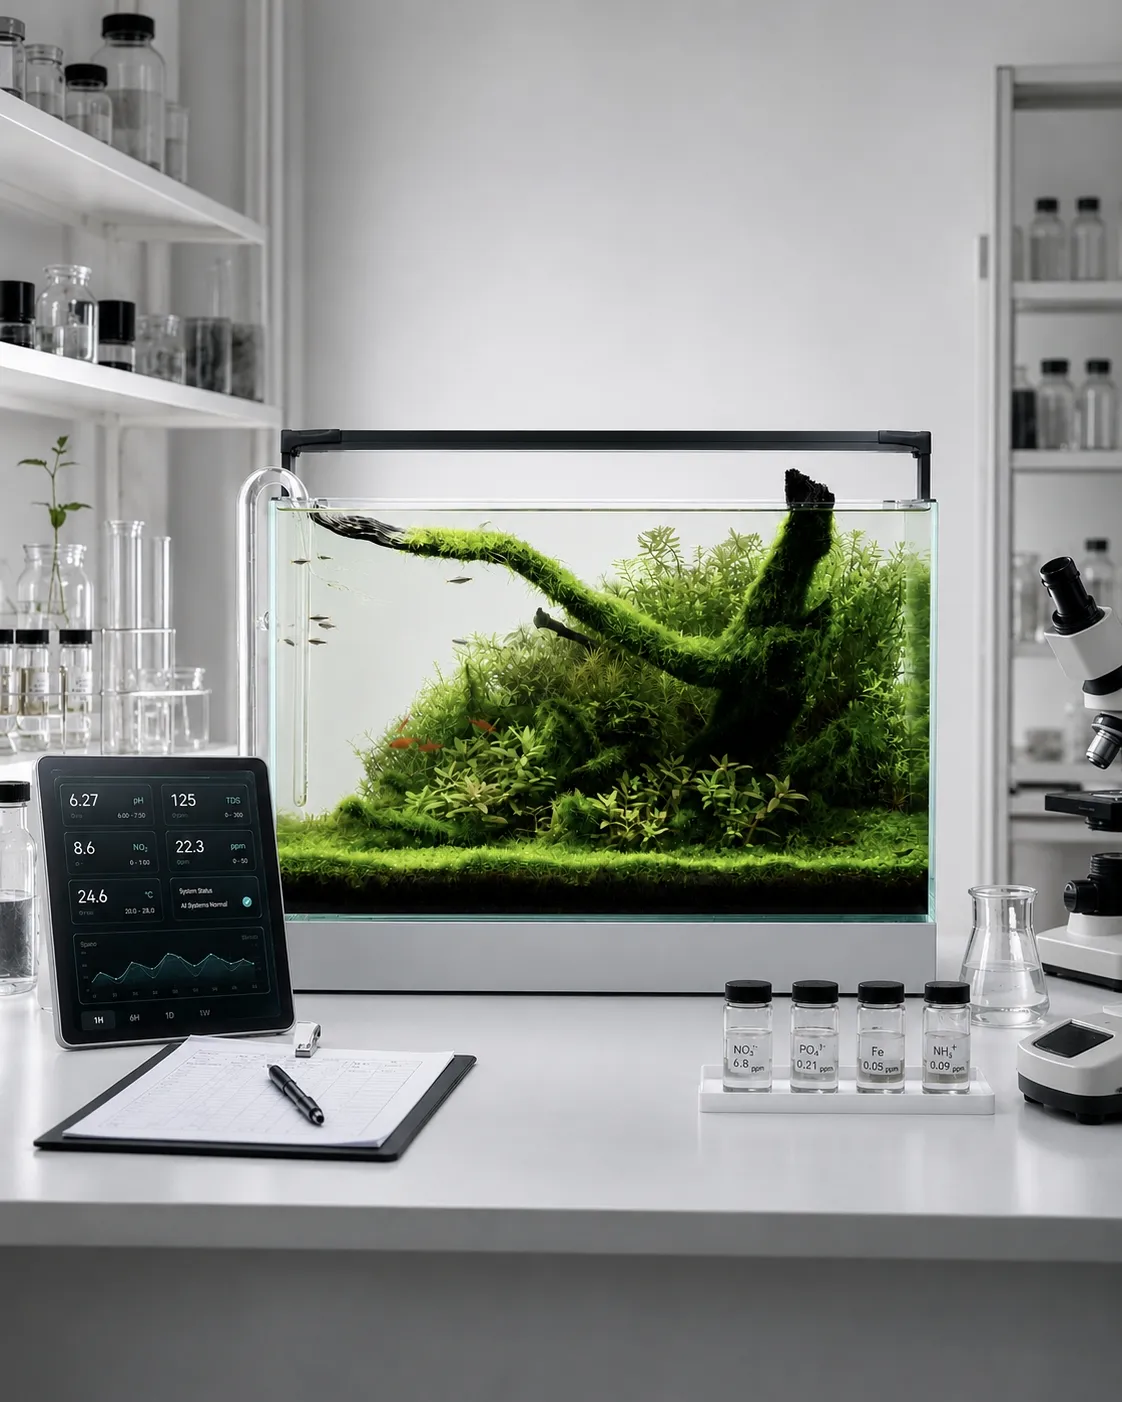
A test tank under observation at YuzhaLab.
Find your way in
Different reasons to be here. One place that answers them.
Some visitors want to learn the science of keeping water healthy. Others come for testing data, build guides, real deployments, or video. Here's where each of those lives.
Aquatic knowledge
The fundamentals of keeping water alive — chemistry, biology, and the reasoning behind every parameter we watch.
ExploreExperiments & testing
What we measure on the bench: equipment behavior, failure modes, and the numbers behind every claim we make.
ExploreProduct notes
Hands-on notes from building and living with our hardware — setup, tuning, and the trade-offs we made along the way.
ExploreSystem guides
Step-by-step builds for complete setups: sensors, controllers, automation logic, alerts, and the wiring between them.
ExploreCase studies
Real tanks and real deployments, documented end to end — what we changed, why, and what the data showed.
ExploreVideos
Watch the work: walkthroughs, integrations, and maintenance routines you can follow along with, step by step.
ExploreFrom the lab
Selected work, not a feed.
A small set of pieces that best show how we think — chosen for depth over volume. More arrives as the lab keeps running.
Knowledge
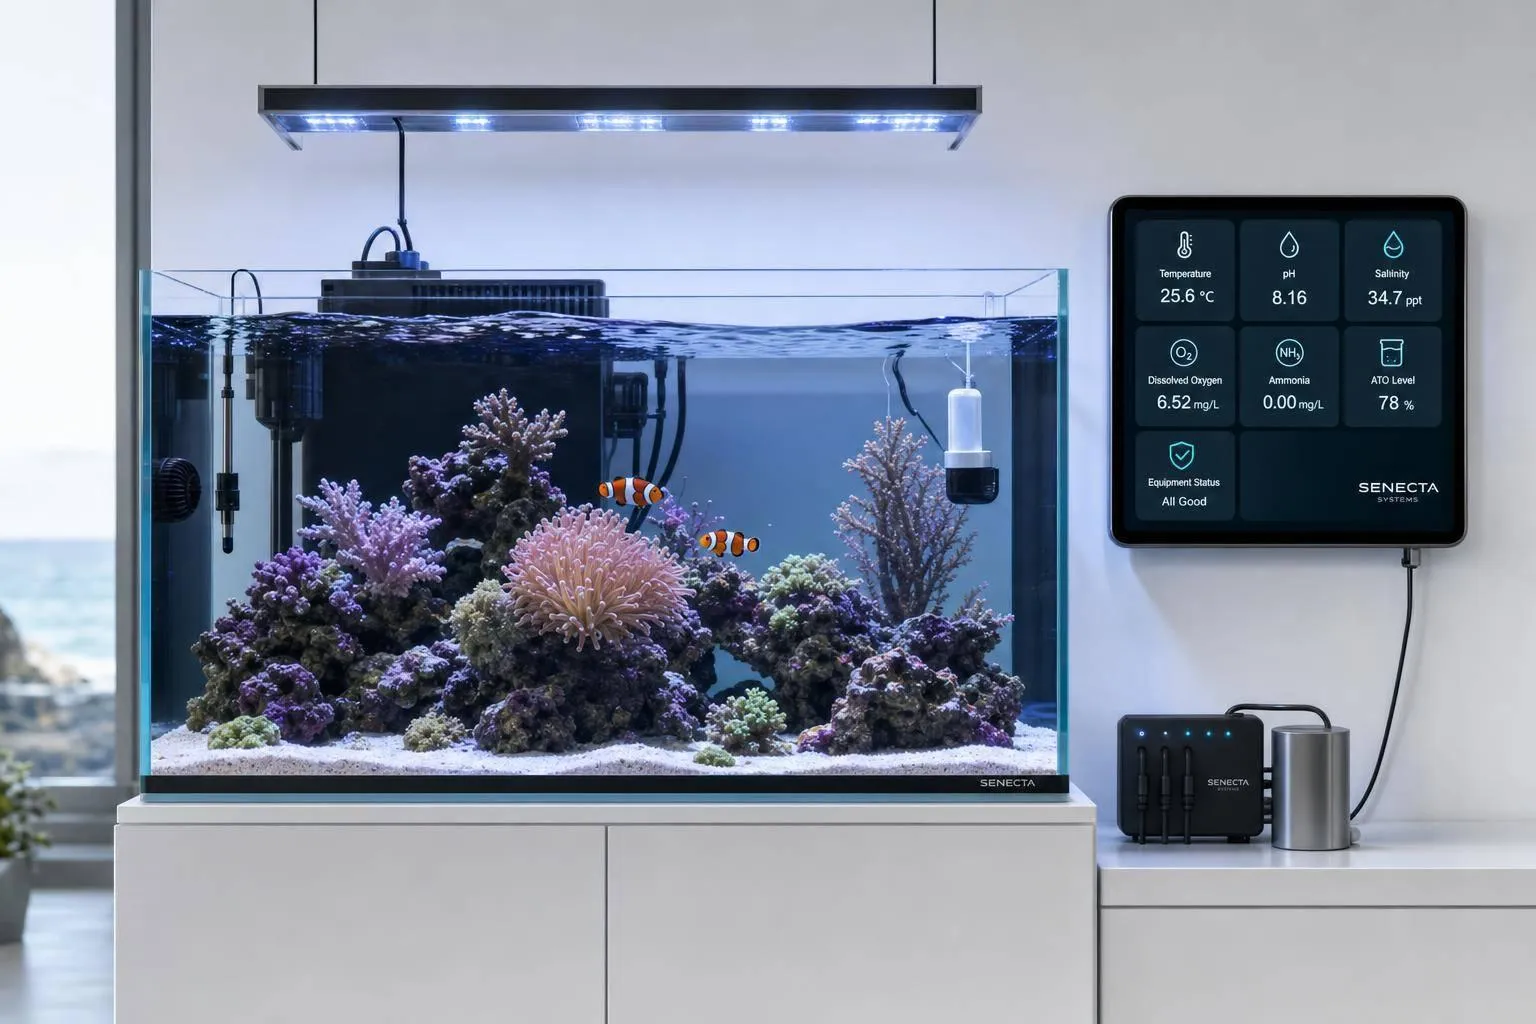
7 Aquarium Parameters You Should Monitor Daily
Five-minute daily checks of temp, pH, salinity, dissolved oxygen, ATO, ammonia and equipment prevent tiny issues turning deadly.
Review
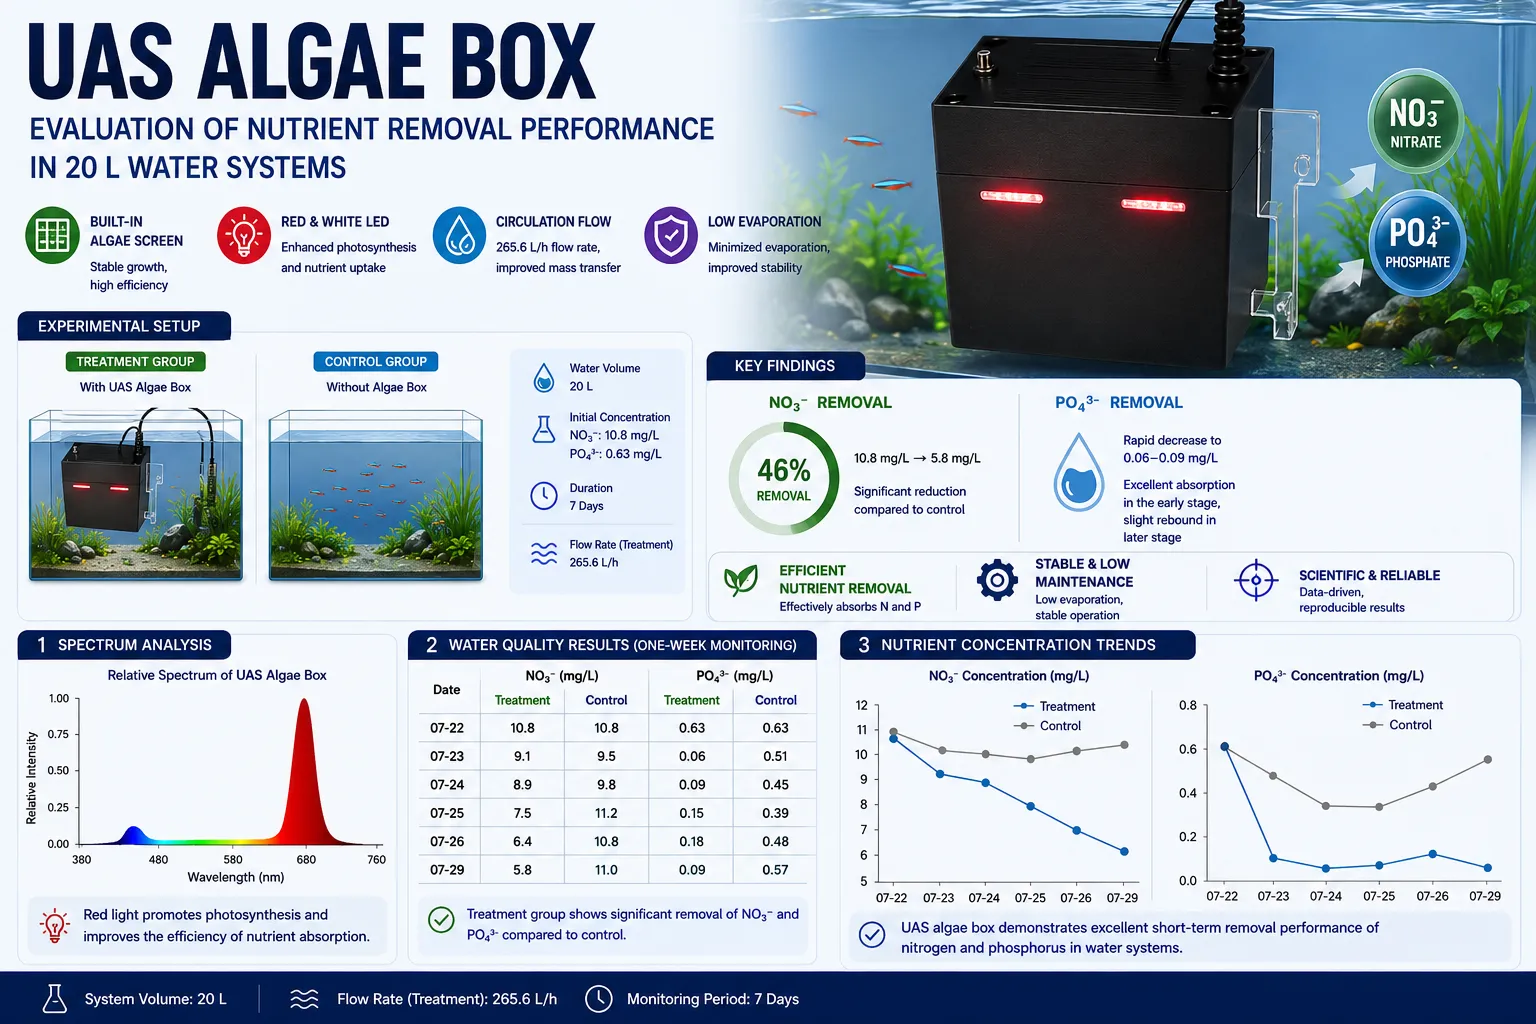
Nitrate and Phosphate Removal by a UAS Algae Box in a 20 L System
A UAS algae box — an enclosed algae scrubber with internal algae screens and its own LED lighting — was run against a no-box control in matched 20 L tanks for one week. Nitrate in the treatment tank fell from 10.8 mg/L to 5.8 mg/L, about 46%, while the control drifted between 9.5 and 11.2 mg/L with no downward trend. Phosphate fell much faster, from 0.63 mg/L to 0.06 mg/L within a day, then drifted back up to 0.18 mg/L mid-week before easing to 0.09 — most likely phosphorus released as algal debris and surface deposits broke down. The practical consequence is that the screens have to be harvested on a schedule: left to accumulate, the box begins returning nutrients it removed earlier. One treatment tank and one control, six sampling points across seven days, and a single pump flow of 265.6 L/h — trend data, not a validated removal rate.
Filter media data
Standardized Quantitative Characterization of Aquarium Filter Media
Four protocols measure aquarium filter media separately instead of reducing it to one surface-area figure: what the material releases or removes over seven days of static immersion (FM-WC), how much particulate it sheds under aeration (FM-PS), how readily water passes through its saturated body (FM-HC), and its mercury-intrusion pore structure down to a 0.5 μm entrance throat (FM-MIP). Surface area is not a directly observed constant — the value moves with the method, the probe, the assumed pore model, the size range and the normalization basis, so every figure published here carries all five and its protocol version. Each protocol runs three independent specimens, traceable from product through acquisition lot, physical unit and specimen to the individual run. None of the four measures nitrification capacity, colonized biofilm area, or how much media a tank needs; those need biological challenge tests and long-term validation this protocol does not attempt.
Research
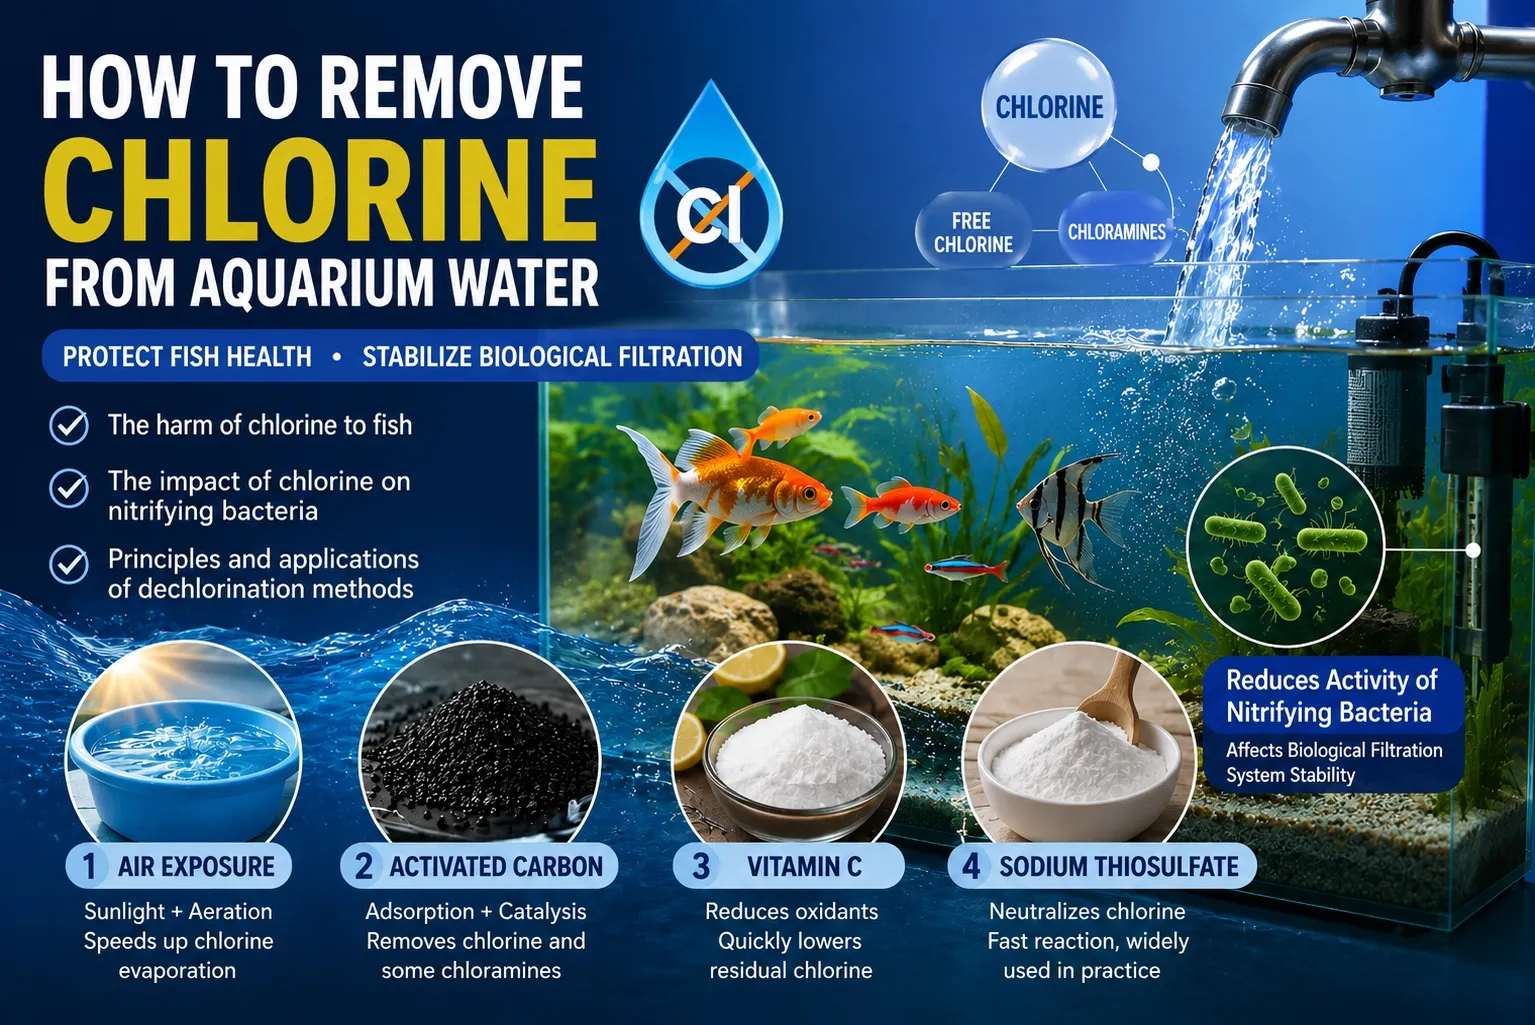
Removing Residual Chlorine from Aquarium Tap Water: Harm to Fish and Nitrifiers, and Four Dechlorination Methods
Tap water leaves the treatment plant carrying at least 0.3 mg/L of residual chlorine and reaches the end of the distribution network at 0.05 mg/L or more — enough to damage fish gills and to inhibit ammonia-oxidising bacteria, the part of the nitrification system least able to spare them. This article reviews that harm, then measures how quickly three approaches actually clear it. Activated carbon was by far the quickest: 200 g in 36 L took residual chlorine from 0.61 mg/L to zero in 35 minutes. Standing under indoor light alone was the slowest — three samples starting near 0.58 mg/L still held 0.02 mg/L after 4 hours 38 minutes. Adding aeration helped but inconsistently: one sample was down to 0.06 mg/L within 80 minutes while the other two tracked the light-only curves. Vitamin C and sodium thiosulfate are covered by principle only and were not measured here. The measured curves live in the figures rather than in the text, and the runs differ in starting concentration and volume, so read them as timescales rather than as a head-to-head ranking.
Review
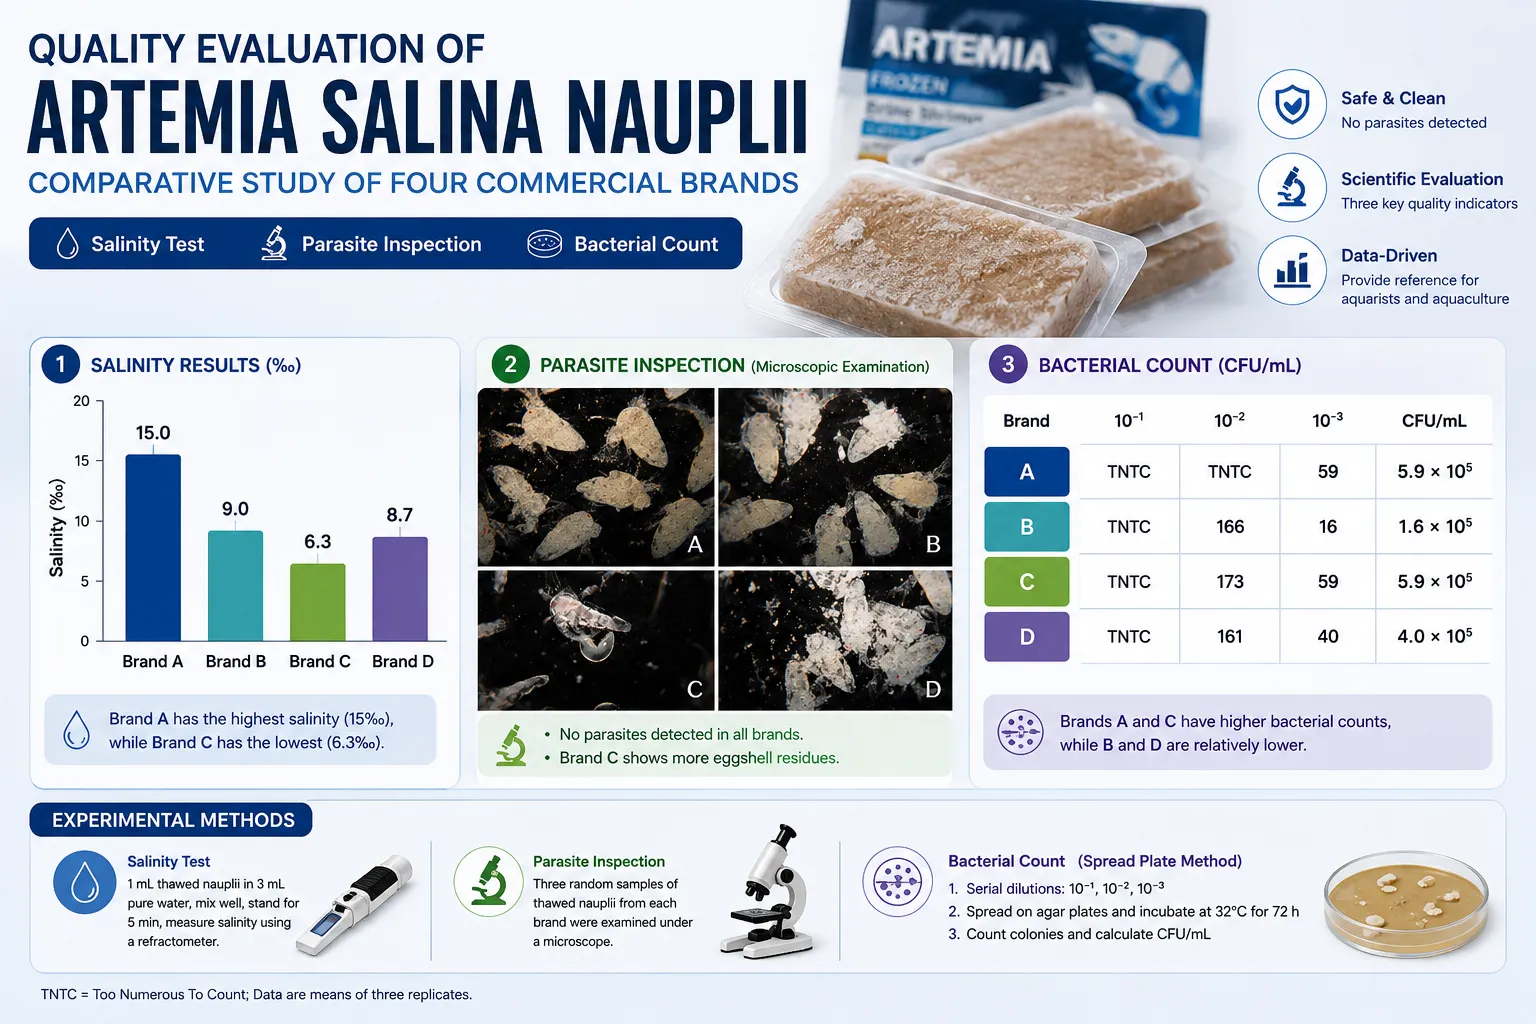
Comparative Evaluation of Artemia salina Nauplii from Four Commercial Brands: Salinity, Parasites and Bacterial Load
Four commercial brands of Artemia salina nauplii were tested for salinity, parasites and bacterial load. No parasites were found in any brand, so the basic sanitary claims hold up. But every brand carried bacteria of the same order of magnitude — from 1.6×10⁵ CFU/mL for the lowest to 5.9×10⁵ CFU/mL for the highest — suggesting that "fully disinfected" marketing does not survive storage and transport. Salinity varied more than expected, from 15‰ down to 6.3‰, and the lowest-salinity brand also showed heavy chorion residue and visible blank ice, pointing to high water content and incomplete processing. At the dilution actually used when feeding, the salt added to tank water is negligible. Three replicates per brand, cultivable bacteria only, and brands are anonymised as A–D.
The YuzhaLab method
An aquarium is one system — not a shelf of devices.
Water chemistry, oxygen, temperature, filtration, microorganisms, plants, animals, lighting, equipment, and your decisions all influence one another. Change one, and the rest respond.
We do not add Wi-Fi to a heater and call it smart. We observe how the whole system behaves over time, document what we find, and turn experience into logic that repeats — so the result does not depend on any one person remembering the right thing at the right moment.
From lab to system
How observation becomes something you can run.
Research only matters if it changes what we build. So everything the lab learns flows directly into the YuzhaLink ecosystem — shaping which products ship, how they behave by default, and what we recommend. This is why YuzhaLab is not a separate content brand. It is the knowledge source behind every YuzhaLink product, platform decision, and solution.
Product decisions
Which features ship, and which ideas the data quietly killed.
Automation rules
The thresholds and routines our controllers run by default.
Alert strategies
What's worth interrupting you for — and, just as important, what isn't.
Recommended setups
Tested configurations you can copy instead of guessing.
YuzhaMatrix templates
Solution blueprints for stores, breeders, and public systems.
By aquatic system
Start from your kind of water.
Not sure where to begin? Enter through a real scenario instead of a category. Each one gathers the knowledge, guides, and cases that fit it.
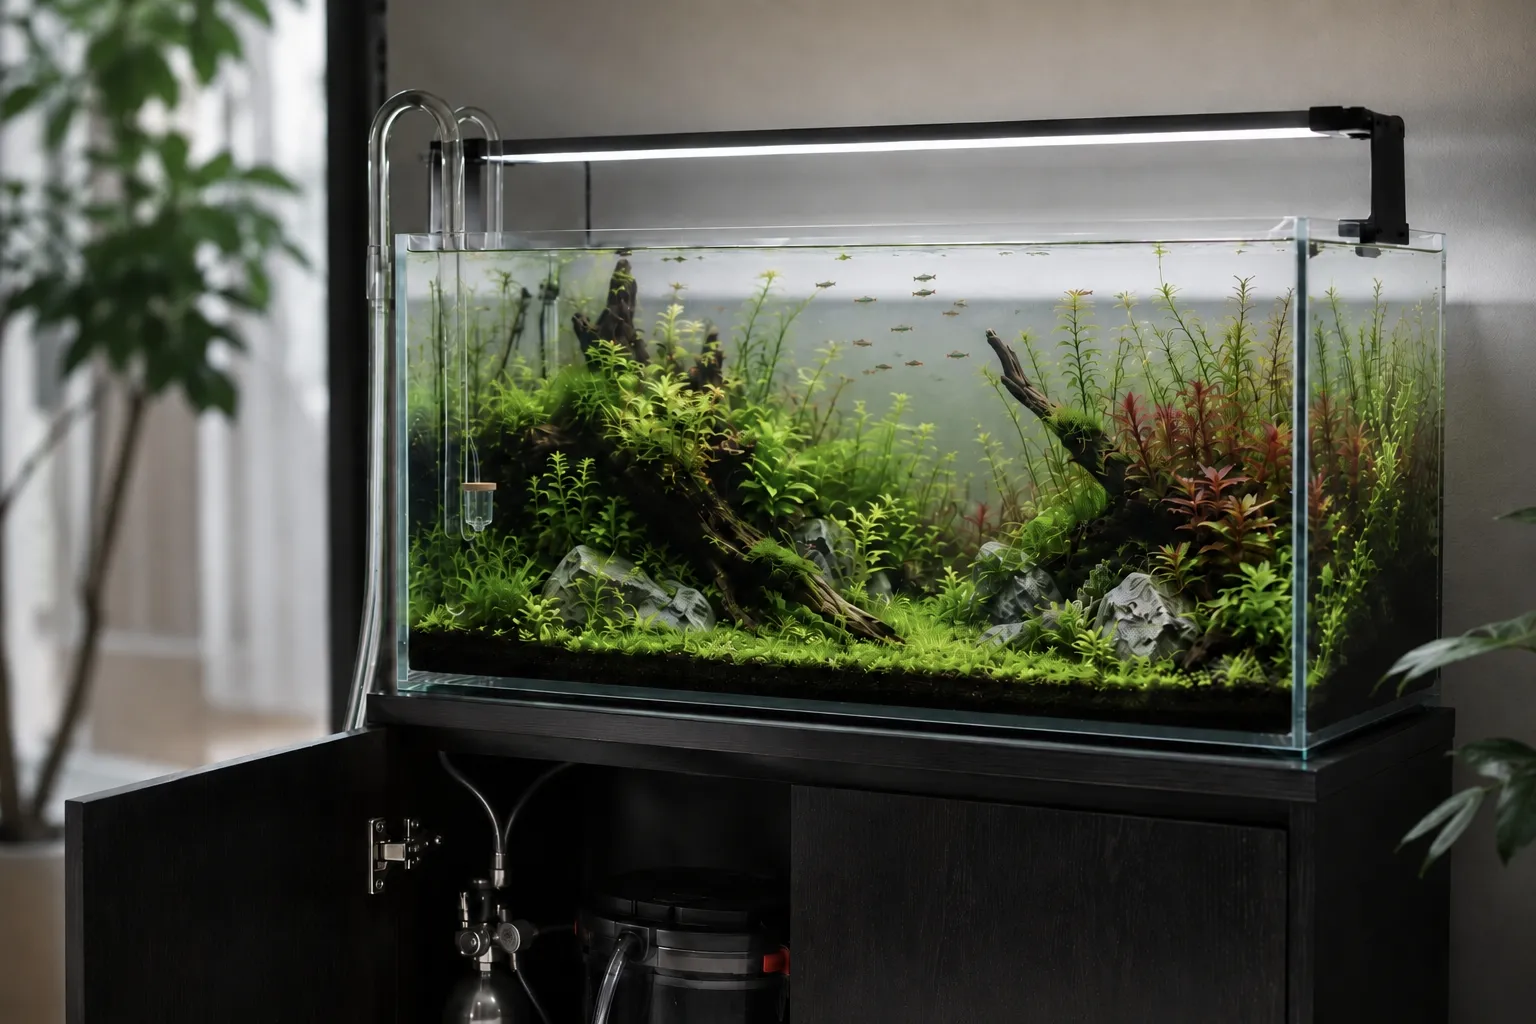
Freshwater planted
Stable CO₂, balanced light, and healthy growth without the algae fight.
Enter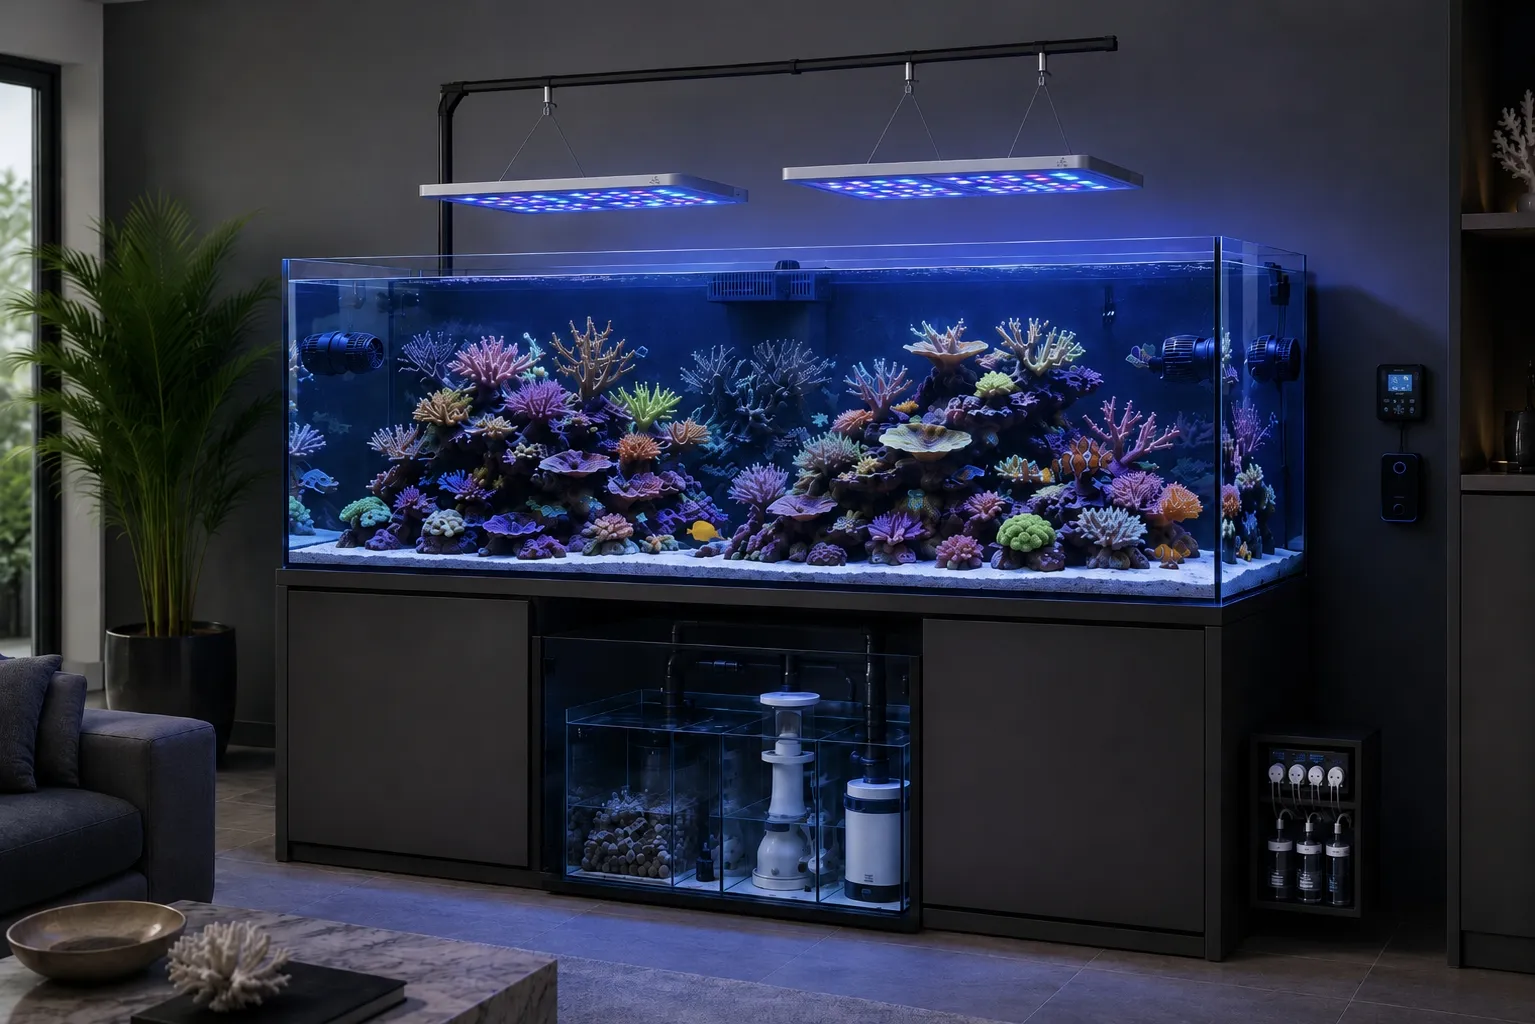
Reef
Parameter discipline for corals and invertebrates that don't forgive swings.
Enter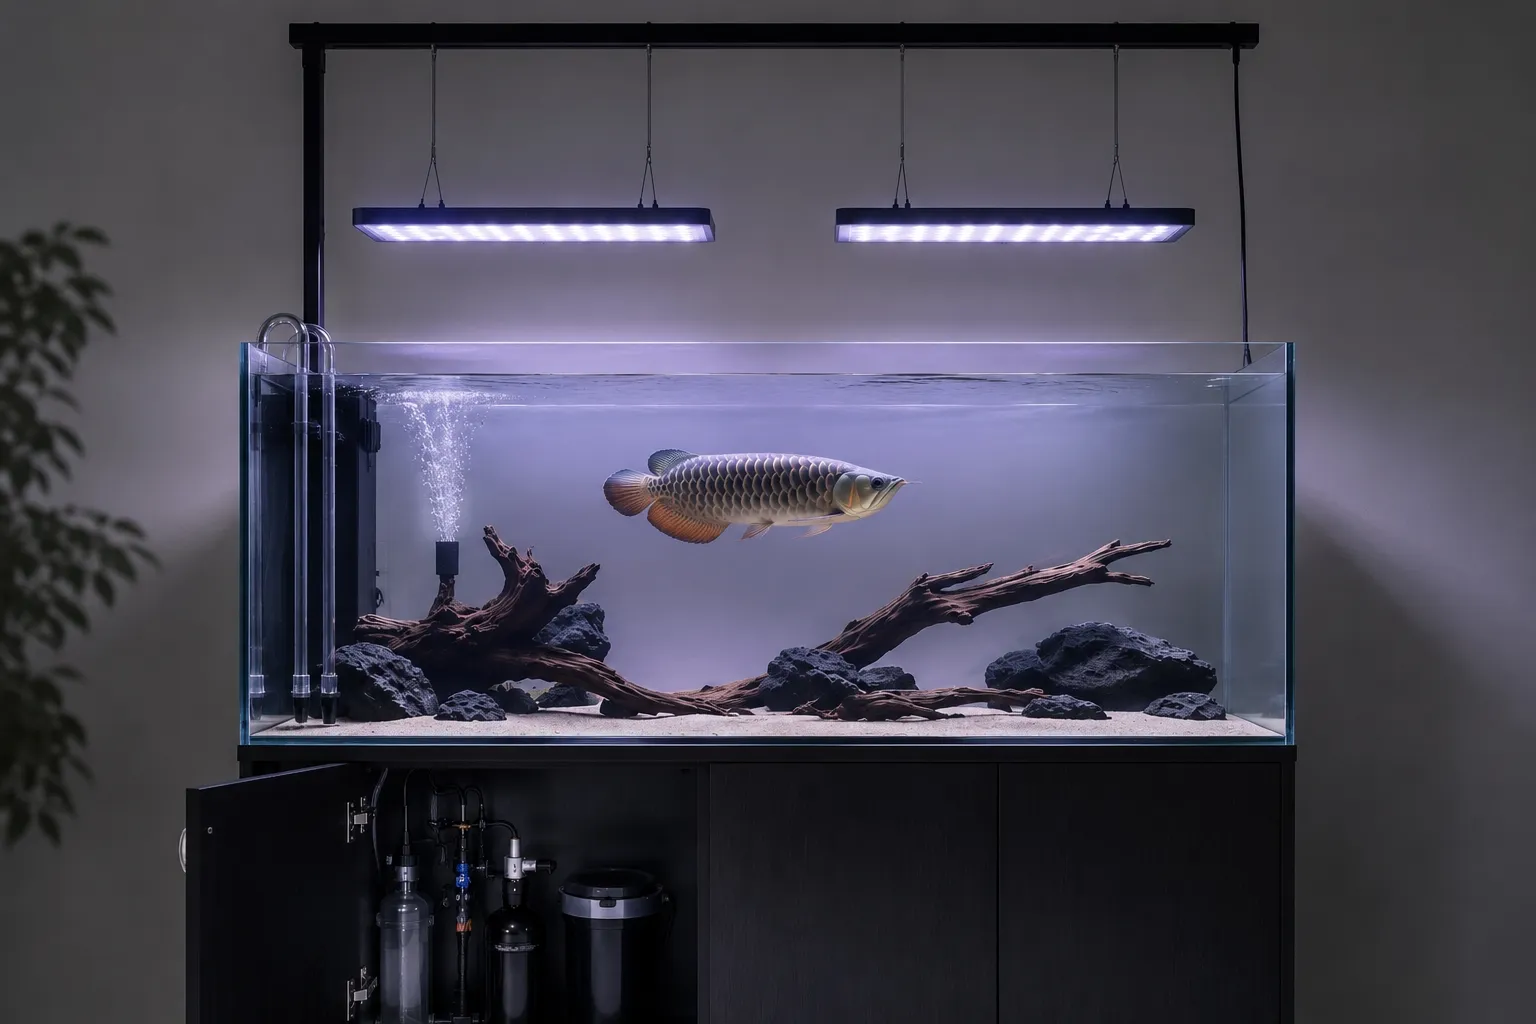
Arowana
Large-fish systems built around water quality and serious filtration.
Enter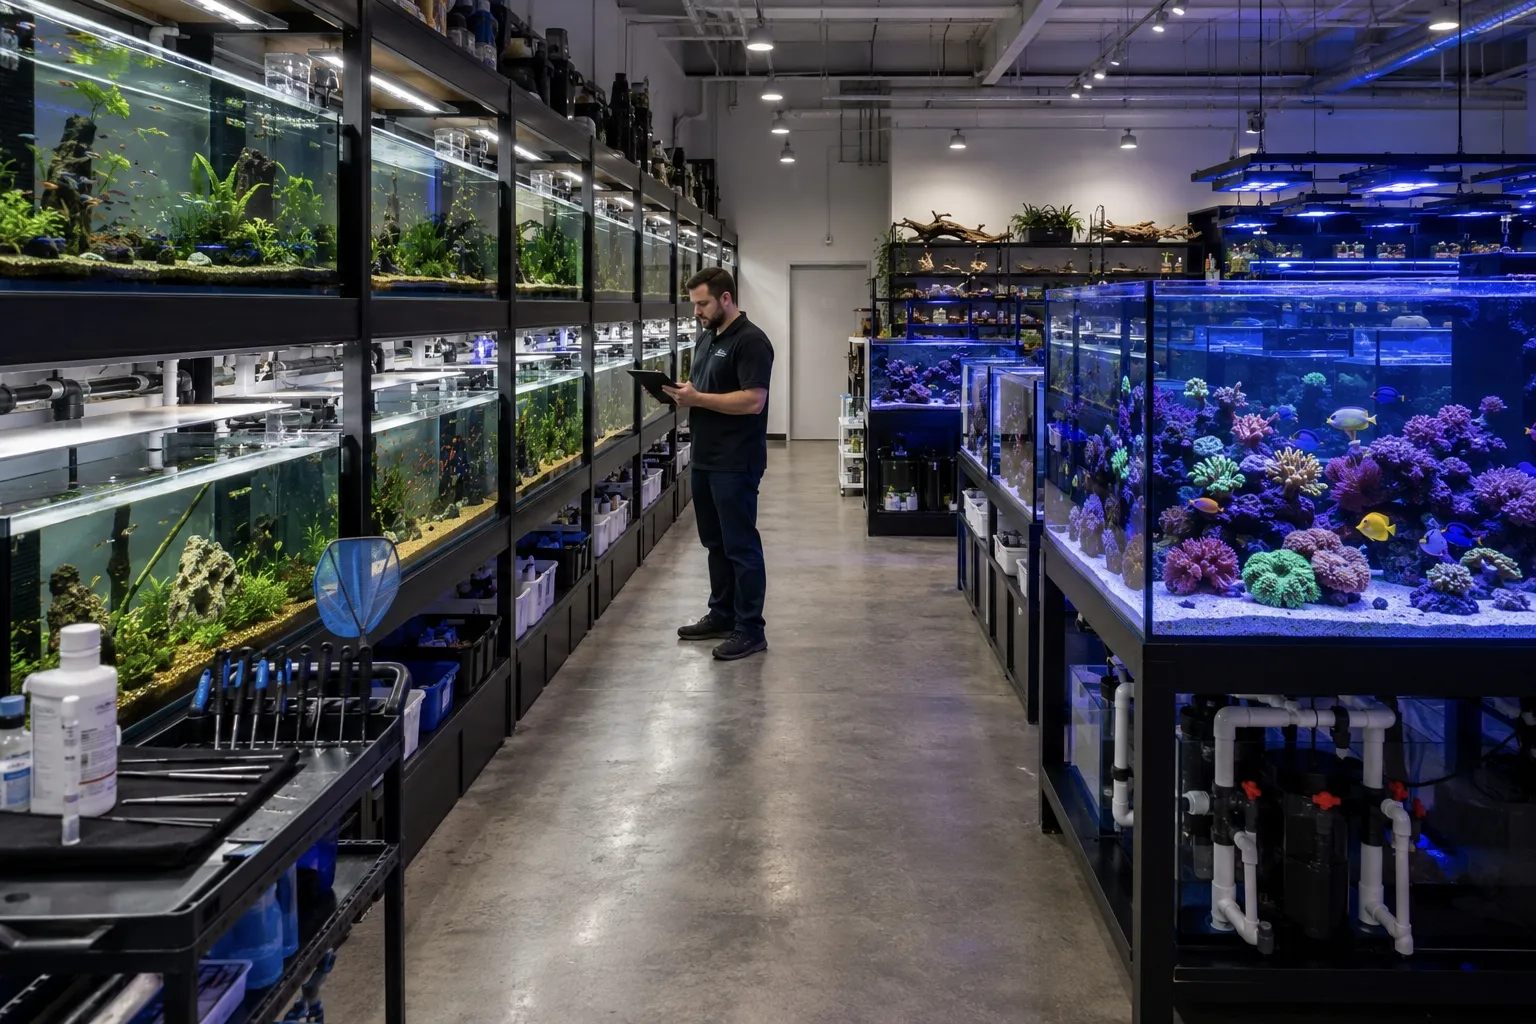
Aquatic stores
Many tanks, one reliable operating routine the whole team can follow.
Enter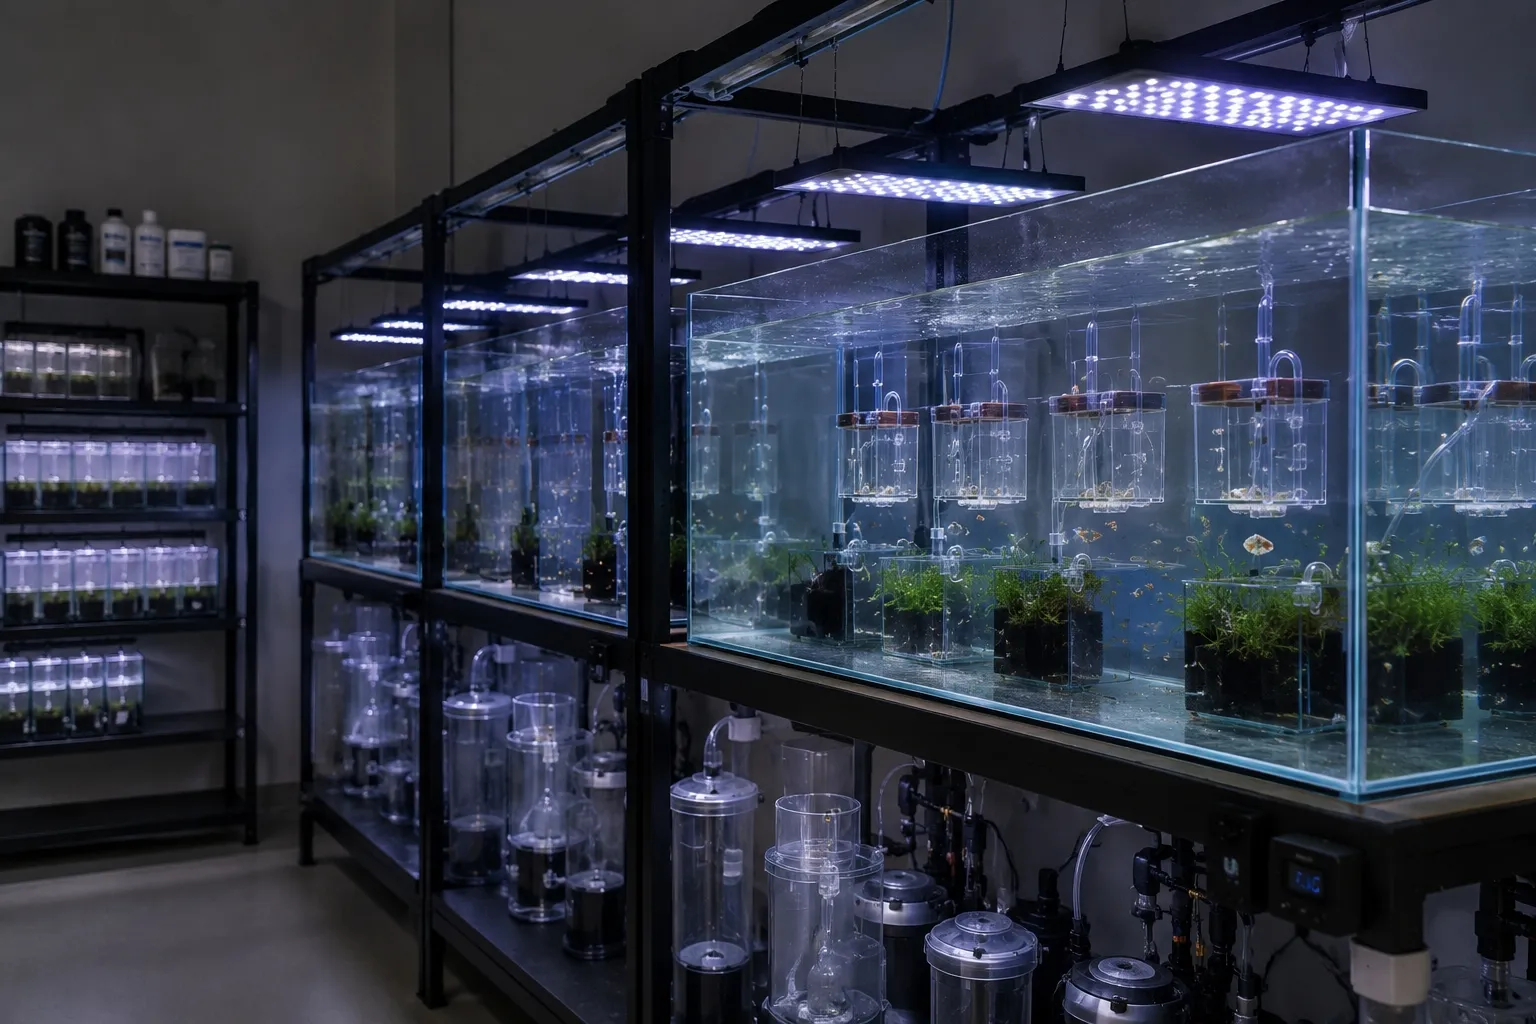
Breeding
Repeatable conditions that turn lucky results into consistent ones.
Enter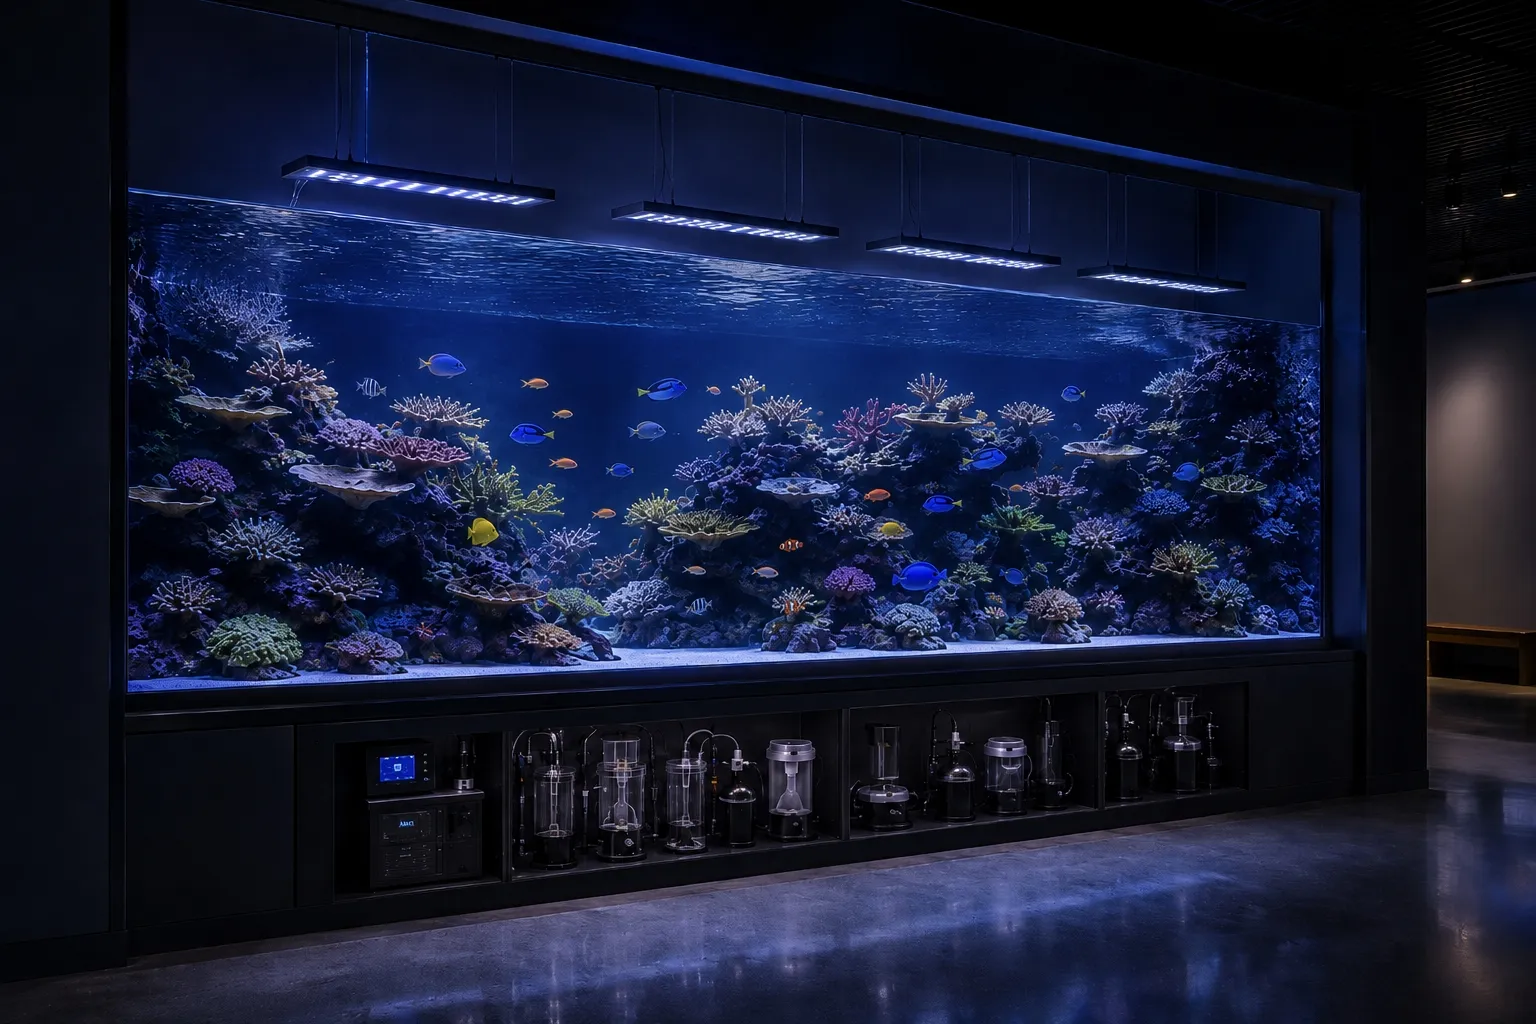
Public display
Large-volume systems that have to run reliably, often unattended.
EnterStay close to the work
The lab keeps running. Follow along.
New research, guides, and videos as they are published — plus the product and platform decisions they lead to.