
Research
Investigation of the Effect of Filter Media Volume on Aquarium Nitrification Efficiency
A sump-filtered 220 L aquarium stocked with 45 fish was given an 18 g overfeeding load at five filter media ratios — 20%, 15%, 10%, 5% and 3% of water volume — measuring how long ammonia nitrogen and nitrite took to return to safe values. A higher ratio lowered both peaks, but at 5% and above the differences in recovery time were limited and every group held stable nitrification; only the 3% group lagged, by roughly one day on nitrite. Each ratio was run once, in sequence in the same system with no parallel replicates, so this is a configuration guide for medium- to low-load home aquariums rather than a validated optimum.
By Dylan Li · 8/17/2026
Abstract
The relationship between filter media volume and nitrification efficiency has long been a concern in aquarium systems. A common view is that increasing the proportion of filter media can improve the nitrification capacity of a system. In practice, however, the actual effect is also influenced by multiple factors, including attachment surface area, water flow, dissolved oxygen, and mass transfer efficiency. In this study, the nitrification performance under different filter media volumes was observed and analyzed under real aquarium operating conditions. The results showed that, under the current system loading conditions, a filter media volume equal to approximately 5% of the water volume was already able to maintain stable nitrification. Increasing the filter media volume further to 20% did not produce a proportional increase in nitrification efficiency. Based on relevant studies on biofilm processes and biological aerated filters, nitrification systems can be regarded as attached-growth biofilm reaction systems. Their actual efficiency depends not only on theoretical attachment area, but also on mass transfer efficiency, dissolved oxygen, hydraulic conditions, and biofilm status. Therefore, filter media configuration in aquarium systems should be designed according to the actual system load, rather than simply pursuing a higher proportion of filter media.
Introduction
The nitrification system is a core component that maintains the stable operation of an aquarium ecosystem. Its main function is to convert ammonia nitrogen, produced from fish metabolism and the decomposition of uneaten feed, into less toxic nitrite and nitrate through the activity of nitrifying bacteria, thereby helping maintain water stability. Because ammonia nitrogen and nitrite are highly toxic to fish, a stable nitrification system is essential for long-term aquarium operation. Based on this, the present experiment aimed to evaluate the effect of different filter media volume configurations on the recovery capacity and treatment efficiency of the nitrification system under real aquarium operating conditions, providing more practical data support for household aquarium filtration systems.
In aquarium systems, nitrifying bacteria mainly exist as attached biofilms on the surface of filter media. Therefore, filter media have long been considered one of the important factors affecting nitrification efficiency [1]. A common view is that increasing filter media volume and surface area can enhance the nitrification capacity of a system. However, previous studies on biofilm processes and biological aerated filters have shown that nitrification efficiency is not only controlled by attachment area, but is also closely related to mass transfer efficiency, dissolved oxygen, hydraulic conditions, biofilm thickness, and system load [2-4]. In practical aquarium applications, some systems use excessive amounts of filter media under the assumption that a higher filter media proportion always means stronger nitrification capacity. In reality, excessive filter media may cause hydraulic short-circuiting, increase internal stagnant zones, accumulate waste, and make maintenance more difficult. It does not necessarily lead to a proportional improvement in actual nitrification efficiency.
Therefore, this study observed and analyzed nitrification performance under different filter media volumes in a real aquarium system, explored the relationship between filter media volume and nitrification efficiency, and discussed the main factors affecting nitrification system performance based on relevant biofilm research.
1. Materials and Methods
1.1 Experimental Materials
Table 1 Materials and experimental setup
Material | Specification/Description | Purpose |
|---|---|---|
Sump-filter aquarium | 100 × 45 × 45 cm | Experimental operating system |
Experimental water | Approximately 220 L | Water environment for the experiment |
Paradise fish | 45 fish | Biological load |
Mature filter media | Filled at 3%, 5%, 10%, 15%, and 20% | Attachment carrier for nitrifying bacteria |
Fish feed | 18 g per feeding | To create an ammonia nitrogen load shock |
Variable-frequency water pump | H008 setting | To provide circulating water flow |
1.2 Instruments and Reagents
Table 2 Instruments and reagents
Instrument/Reagent | Model/Specification | Purpose |
|---|---|---|
Spectrophotometer | Hach DR3900 | Detection of ammonia nitrogen, nitrite, and nitrate |
Portable dissolved oxygen meter | Hach | Dissolved oxygen (DO) detection |
Portable pH meter | Hach | pH detection |
KH titration test reagent | Domestic brand | Carbonate hardness detection |
GH test kit | Domestic brand | General hardness detection |
Ammonia nitrogen powder reagent pillow | Hach | Ammonia nitrogen detection |
Nitrite nitrogen powder reagent pillow | Hach | Nitrite detection |
Nitrate nitrogen powder reagent pillow | Hach | Nitrate detection |
Cuvette | 10 mL | Colorimetric water sample testing |
Pipette | 10 mL | Quantitative sampling |
Pipette tips | 10 mL | Supporting experimental consumables |
1.3 Experimental Method
- A 100 cm × 45 cm × 45 cm sump-filter aquarium was prepared and fitted with a water pump. The system was filled with 220 L of water. During the experiment, the pump was uniformly set to the H008 setting for all groups. First, 20% filter media was added to the filter chamber, and 45 fish were placed in the aquarium. After the system was running, the water quality was tested. Then, 18 g of fish feed was added as an overfeeding load to test the treatment capacity of the nitrification system, specifically how long it took for ammonia nitrogen and nitrite to return to safe values.
- After nitrite returned to the safe range, the aquarium was cleaned and the main tank water was replaced. Then, 15% filter media was added to the filter chamber. Another 18 g overfeeding load was applied to test the treatment capacity of the nitrification system, specifically how long it took for ammonia nitrogen and nitrite to return to safe values.
- After nitrite returned to the safe range, the aquarium was cleaned and the main tank water was replaced. Then, 10% filter media was added to the filter chamber. Another 18 g overfeeding load was applied to test the treatment capacity of the nitrification system, specifically how long it took for ammonia nitrogen and nitrite to return to safe values.
- After nitrite returned to the safe range, the aquarium was cleaned and the main tank water was replaced. Then, 5% filter media was added to the filter chamber. Another 18 g overfeeding load was applied to test the treatment capacity of the nitrification system, specifically how long it took for ammonia nitrogen and nitrite to return to safe values.
- After nitrite returned to the safe range, the aquarium was cleaned and the main tank water was replaced. Then, 3% filter media was added to the filter chamber. Another 18 g overfeeding load was applied to test the treatment capacity of the nitrification system, specifically how long it took for ammonia nitrogen and nitrite to return to safe values.
2. Experimental Results
Table 1. 20% filter media volume
Date | Water temperature (°C) | DO (mg/L) | pH | KH (°dKH) | GH (mg/L) | Ammonia nitrogen (mg/L) | Nitrite (mg/L) | Nitrate (mg/L) |
|---|---|---|---|---|---|---|---|---|
2024/11/5 | 24.3 | 8.32 | 8.27 | 9 | 200 | 0.00 | 0.021 | 3.2 |
2024/11/6 | 26.9 | 7.67 | 8.00 | 9 | 200 | 0.01 | 0.039 | 8.3 |
2024/11/7 | 26.2 | 7.83 | 8.55 | 9 | 200 | 0.00 | 0.077 | 4.7 |
2024/11/8 | 25.6 | 8.15 | 8.46 | 9 | 200 | 0.05 | 0.024 | 8.0 |
Table 2. 15% filter media volume
Date | Water temperature (°C) | DO (mg/L) | pH | KH (°dKH) | GH (mg/L) | Ammonia nitrogen (mg/L) | Nitrite (mg/L) | Nitrate (mg/L) |
|---|---|---|---|---|---|---|---|---|
2024/11/11 | 25.1 | 8.26 | 8.32 | 11 | 200 | 0.00 | 0.014 | 5.0 |
2024/11/12 | 25.8 | 7.79 | 8.44 | 11 | 200 | 0.24 | 0.055 | 7.3 |
2024/11/13 | 25.2 | 8.13 | 8.38 | 11 | 200 | 0.00 | 0.081 | 6.3 |
2024/11/14 | 25.2 | 8.19 | 8.60 | 12 | 200 | 0.00 | 0.025 | 7.4 |
Table 3. 10% filter media volume
Date | Water temperature (°C) | DO (mg/L) | pH | KH (°dKH) | GH (mg/L) | Ammonia nitrogen (mg/L) | Nitrite (mg/L) | Nitrate (mg/L) |
|---|---|---|---|---|---|---|---|---|
2024/11/18 | 23.3 | 8.17 | 8.23 | 12 | 200 | 0.00 | 0.014 | 6.4 |
2024/11/19 | 25.7 | 7.81 | 8.08 | 12 | 200 | 0.40 | 0.050 | 7.7 |
2024/11/20 | 26.1 | 7.94 | 8.13 | 12 | 200 | 0.04 | 0.075 | 7.2 |
2024/11/21 | 25.6 | 8.10 | 8.16 | 10 | 200 | 0.02 | 0.015 | 10.4 |
Table 4. 5% filter media volume
Date | Water temperature (°C) | DO (mg/L) | pH | KH (°dKH) | GH (mg/L) | Ammonia nitrogen (mg/L) | Nitrite (mg/L) | Nitrate (mg/L) |
|---|---|---|---|---|---|---|---|---|
2024/11/25 | 24.4 | 8.14 | 8.04 | 12 | 200 | 0.01 | 0.010 | 6.8 |
2024/11/26 | 25.7 | 7.78 | 8.16 | 12 | 200 | 0.44 | 0.074 | 9.5 |
2024/11/27 | 26.1 | 7.95 | 8.45 | 12 | 200 | 0.04 | 0.123 | 8.7 |
2024/11/28 | 25.6 | 7.97 | 8.26 | 12 | 200 | 0.03 | 0.029 | 9.6 |
Table 5. 3% filter media volume
Date | Water temperature (°C) | DO (mg/L) | pH | KH (°dKH) | GH (mg/L) | Ammonia nitrogen (mg/L) | Nitrite (mg/L) | Nitrate (mg/L) |
|---|---|---|---|---|---|---|---|---|
2024/12/2 | 24.6 | 7.18 | 8.26 | 12 | 200 | 0.04 | 0.009 | 7.5 |
2024/12/3 | 25.8 | 7.72 | 8.39 | 12 | 200 | 0.49 | 0.108 | 10.1 |
2024/12/4 | 24.9 | 8.03 | 8.61 | 12 | 200 | 0.07 | 0.165 | 12.3 |
2024/12/5 | 24.6 | 8.11 | 8.76 | 12 | 200 | 0.02 | 0.069 | 8.6 |
2024/12/6 | 24.9 | 8.16 | 8.26 | 12 | 200 | 0.00 | 0.022 | 12.4 |
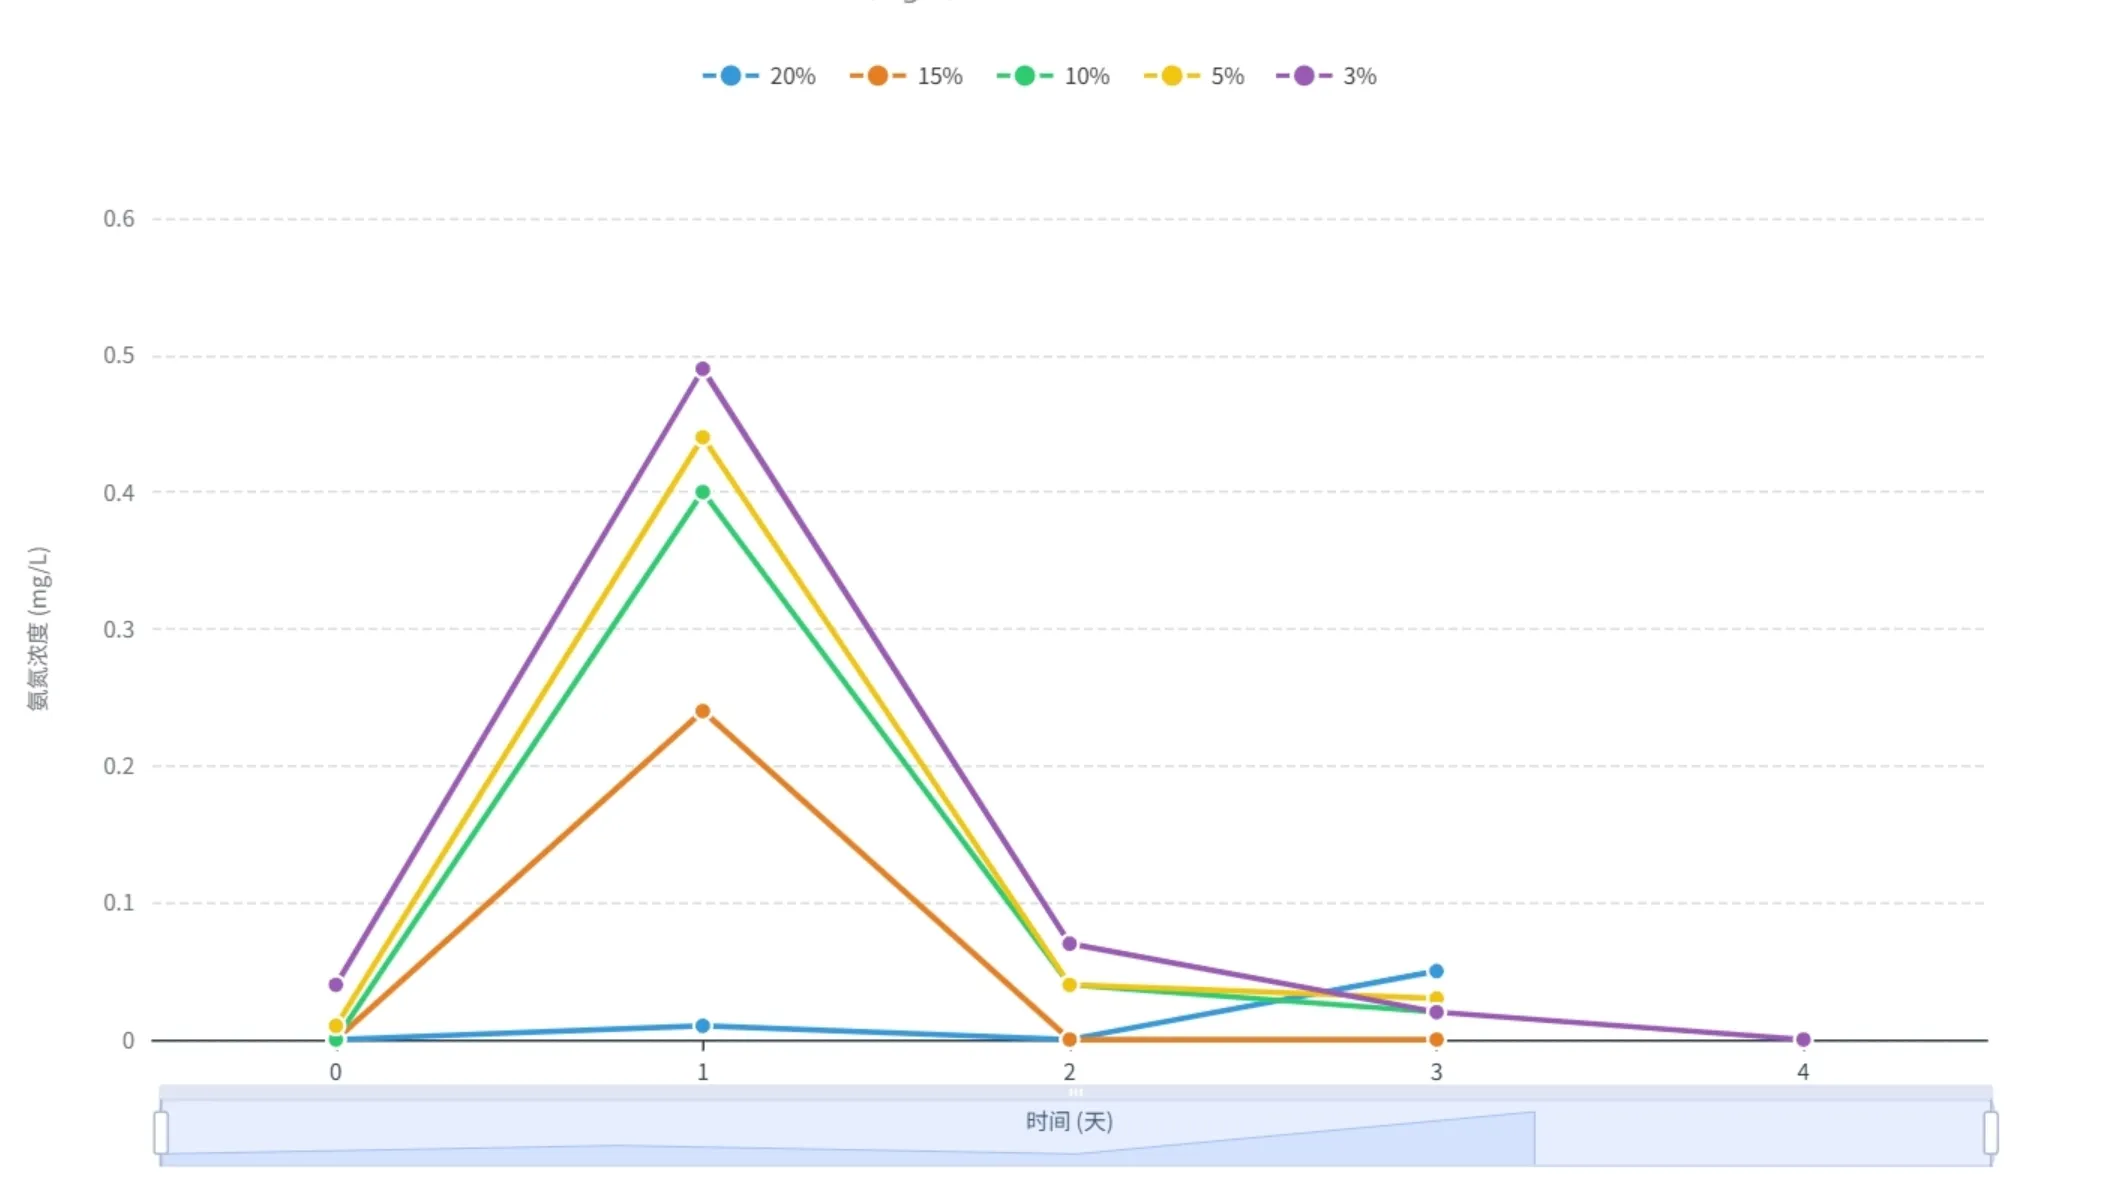
Figure 1. Variation of ammonia nitrogen with time under different filter media volumes
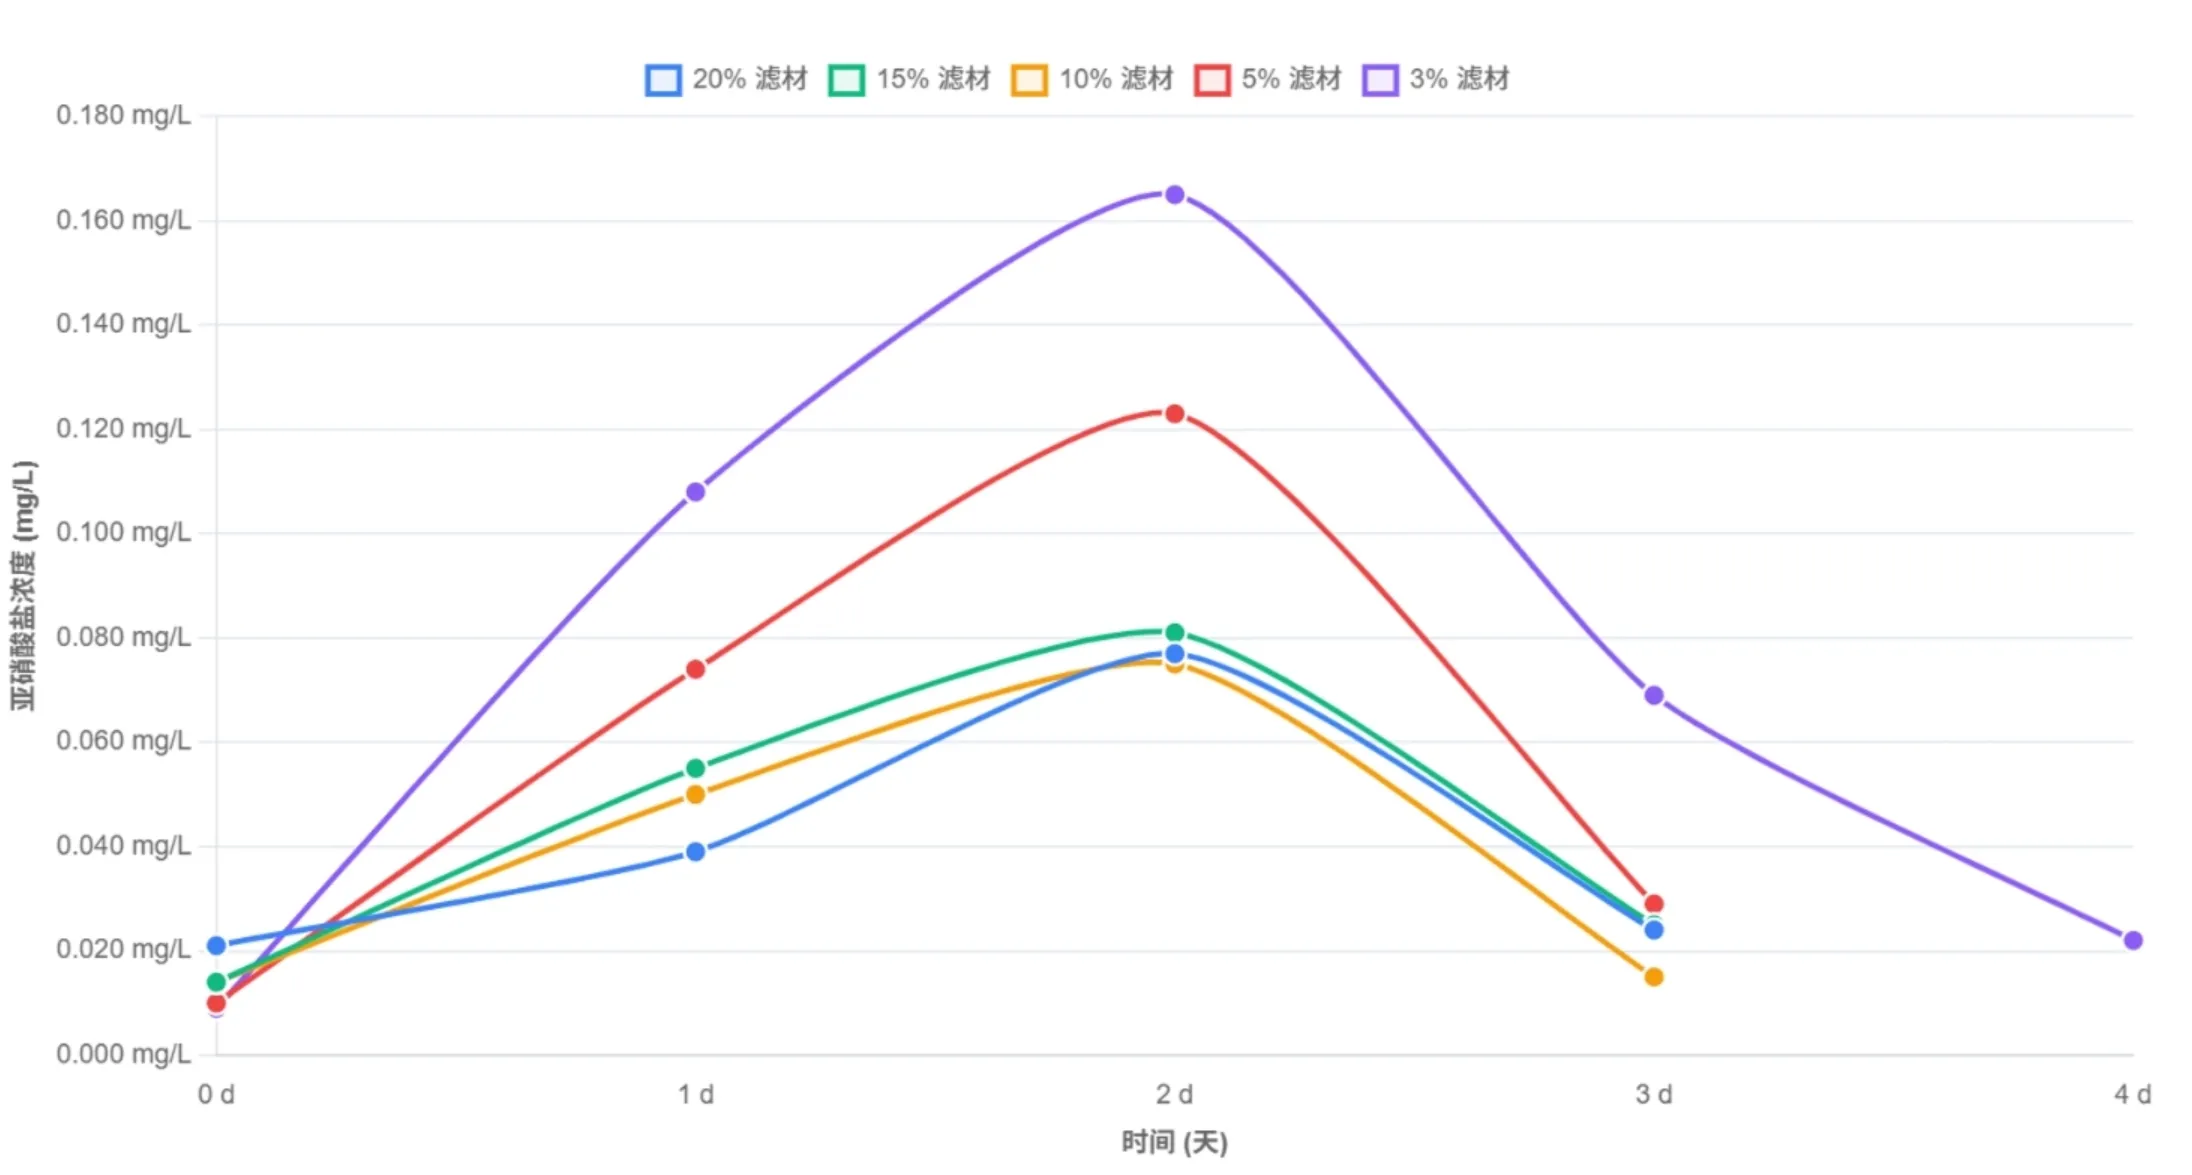
Figure 2. Variation of nitrite with time under different filter media volumes
3. Results and Analysis
- This experiment investigated the effect of filter media volume on water treatment performance under five different filling ratios. As shown in Figure 1, a higher filter media ratio corresponded to a lower peak ammonia nitrogen concentration. This indicates that ammonia-oxidizing bacteria were able to process accumulated ammonia nitrogen more rapidly. In contrast, when the filter media ratio was lower, ammonia-oxidizing bacteria were less able to process the accumulated ammonia nitrogen in time, resulting in greater ammonia nitrogen accumulation.
- As shown in Figure 2, only the 3% filter media group showed a roughly one-day delay in nitrite returning to the safe range, while the other four groups showed generally similar recovery patterns. The nitrite peak values in Figure 2 also indicate that a higher filter media ratio provided better control of nitrite levels. This suggests that the nitrite oxidation process was more complete, allowing the system to reduce accumulated nitrite back to the safe range more quickly. The experiment shows that filter media ratio affects the nitrite peak in the aquarium system.
4. Conclusion
- The results of this experiment show that, under the current experimental conditions and system load, filter media volume affected the treatment capacity of the aquarium nitrification system, but the relationship was not simply linear.
- As the filter media ratio increased, the system showed better buffering capacity against ammonia nitrogen and nitrite peaks. However, at 5% and above, the differences in overall recovery time among the groups were limited, and all groups were able to maintain stable nitrification.
- This indicates that, for medium- to low-load household aquarium systems, filter media configuration should focus more on effective attachment area, water flow-through efficiency, and overall system matching, rather than simply pursuing a higher proportion of filter media [2-4].
References
[1] Prosser J I. Autotrophic nitrification in bacteria[J]. Advances in Microbial Physiology, 1989, 30:125-181.
[2] Rittmann B E, McCarty P L. Environmental Biotechnology: Principles and Applications[M]. McGraw-Hill, 2001.
[3] Ødegaard H. Innovations in wastewater treatment: the moving bed biofilm process[J]. Water Science and Technology, 2006, 53(9):17-33.
[4] Rusten B, Hem L J, Ødegaard H. Nitrification of municipal wastewater in moving-bed biofilm reactors[J]. Water Environment Research, 1995, 67(1):75-86.