
All YuzhaLab articles
Knowledge, experiments, product notes, guides, case studies and filter media data — every library in one list.
Knowledge
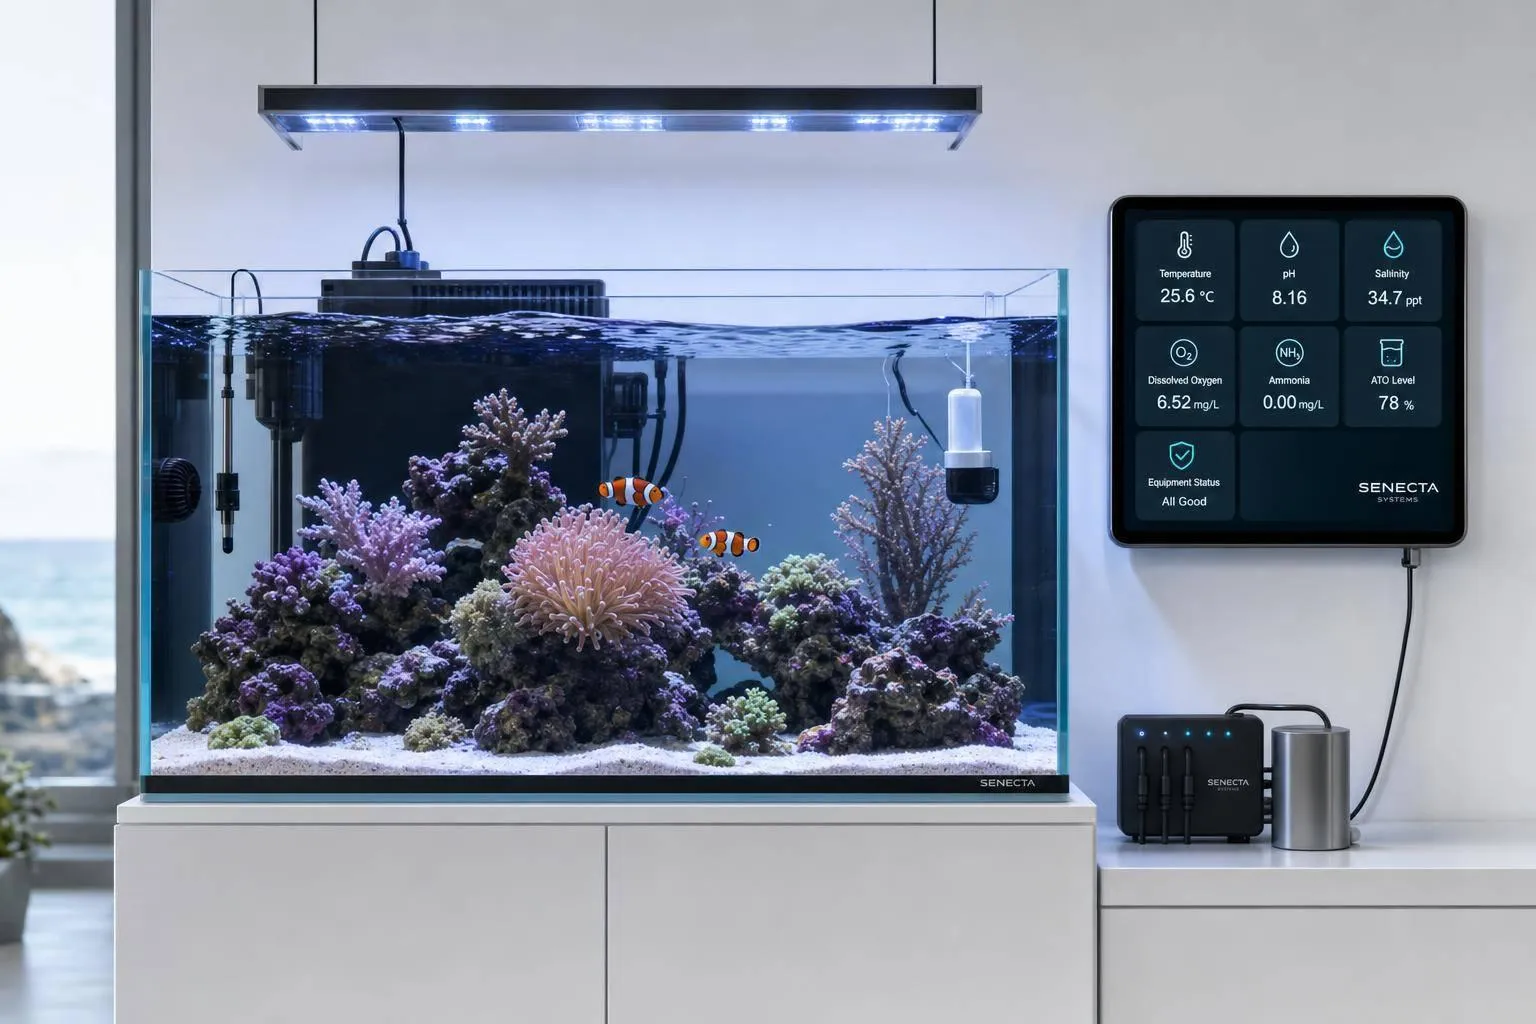
7 Aquarium Parameters You Should Monitor Daily
Five-minute daily checks of temp, pH, salinity, dissolved oxygen, ATO, ammonia and equipment prevent tiny issues turning deadly.
Review
Nitrate and Phosphate Removal by a UAS Algae Box in a 20 L System
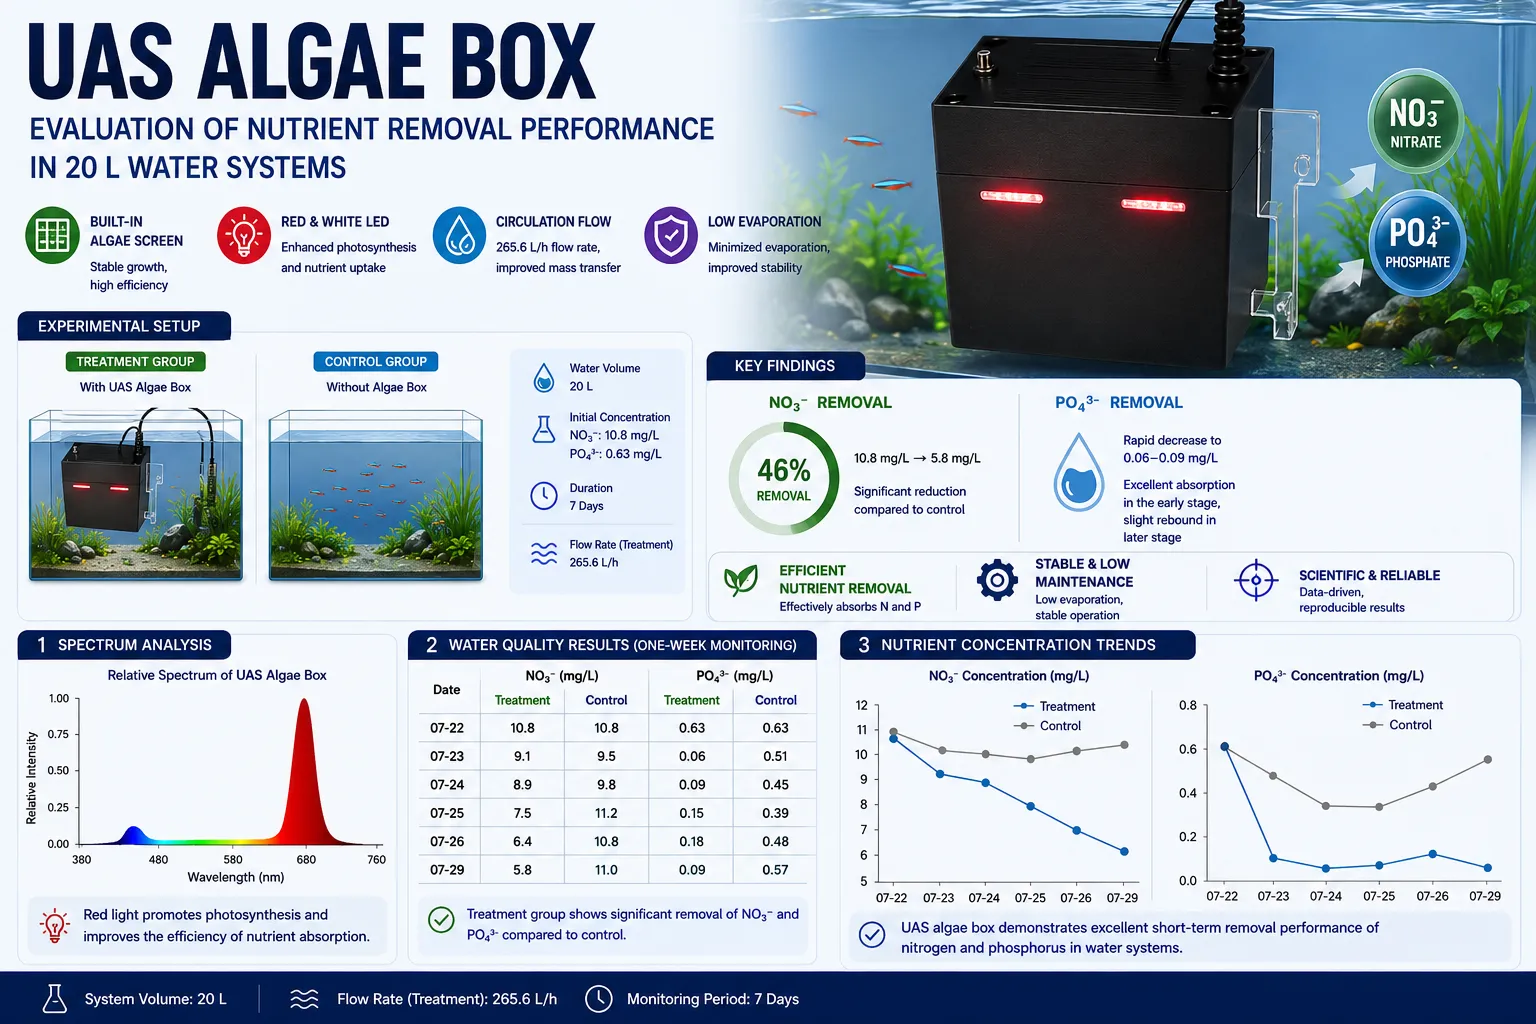
A UAS algae box — an enclosed algae scrubber with internal algae screens and its own LED lighting — was run against a no-box control in matched 20 L tanks for one week. Nitrate in the treatment tank fell from 10.8 mg/L to 5.8 mg/L, about 46%, while the control drifted between 9.5 and 11.2 mg/L with no downward trend. Phosphate fell much faster, from 0.63 mg/L to 0.06 mg/L within a day, then drifted back up to 0.18 mg/L mid-week before easing to 0.09 — most likely phosphorus released as algal debris and surface deposits broke down. The practical consequence is that the screens have to be harvested on a schedule: left to accumulate, the box begins returning nutrients it removed earlier. One treatment tank and one control, six sampling points across seven days, and a single pump flow of 265.6 L/h — trend data, not a validated removal rate.
Filter media data
Standardized Quantitative Characterization of Aquarium Filter Media
Four protocols measure aquarium filter media separately instead of reducing it to one surface-area figure: what the material releases or removes over seven days of static immersion (FM-WC), how much particulate it sheds under aeration (FM-PS), how readily water passes through its saturated body (FM-HC), and its mercury-intrusion pore structure down to a 0.5 μm entrance throat (FM-MIP). Surface area is not a directly observed constant — the value moves with the method, the probe, the assumed pore model, the size range and the normalization basis, so every figure published here carries all five and its protocol version. Each protocol runs three independent specimens, traceable from product through acquisition lot, physical unit and specimen to the individual run. None of the four measures nitrification capacity, colonized biofilm area, or how much media a tank needs; those need biological challenge tests and long-term validation this protocol does not attempt.
Research
Removing Residual Chlorine from Aquarium Tap Water: Harm to Fish and Nitrifiers, and Four Dechlorination Methods
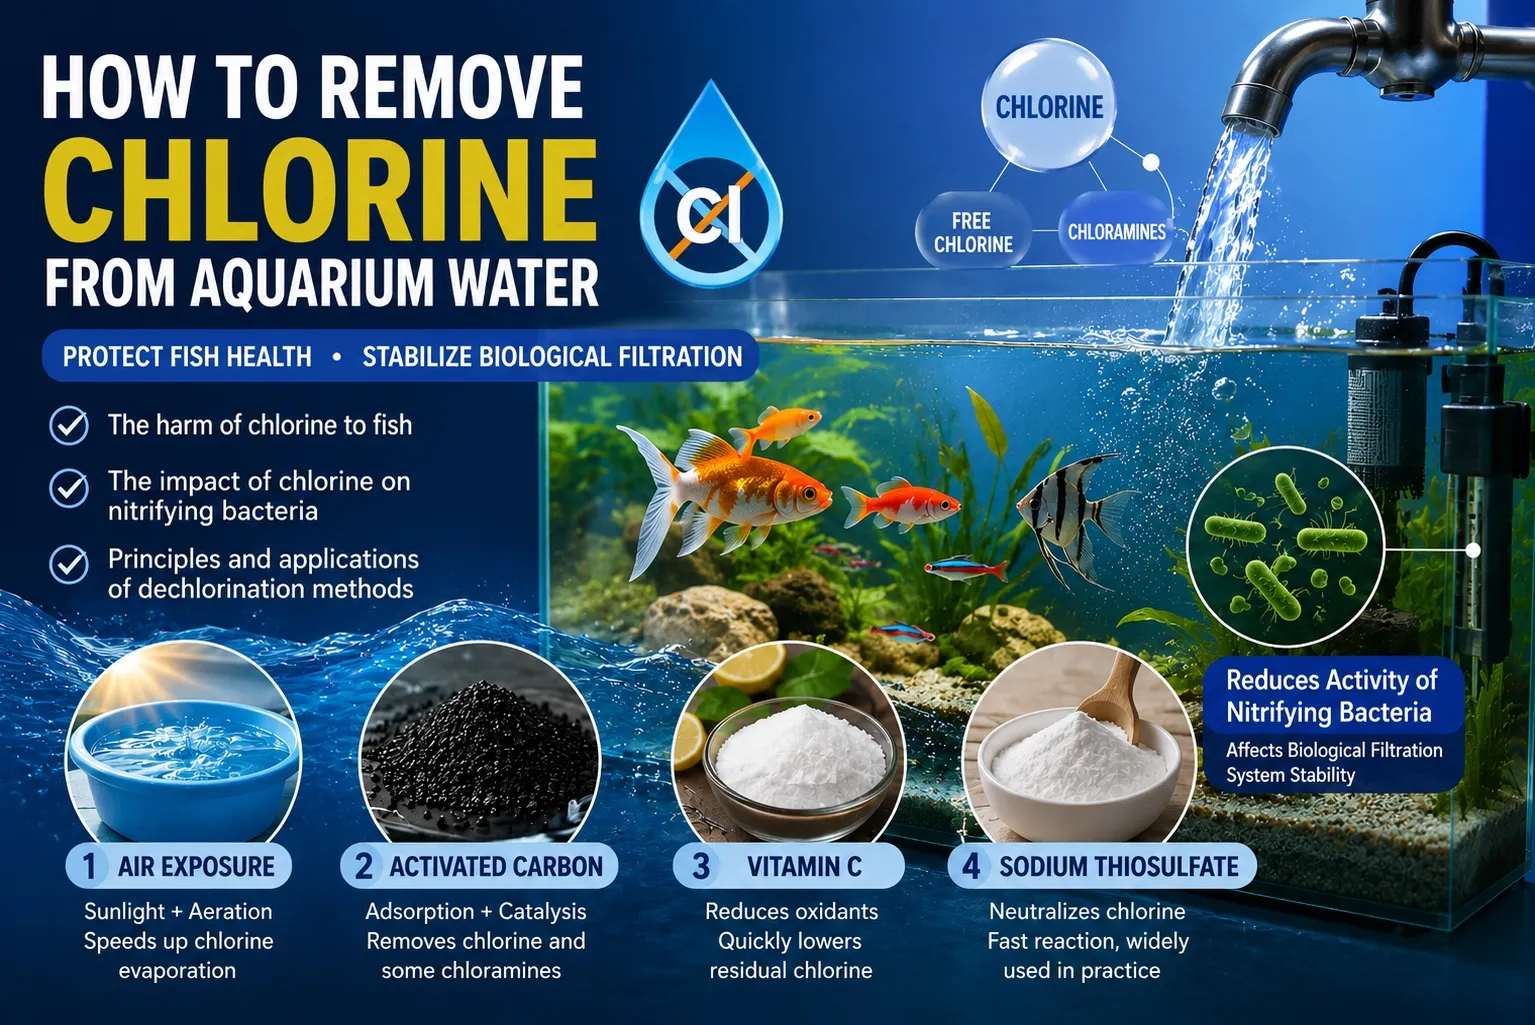
Tap water leaves the treatment plant carrying at least 0.3 mg/L of residual chlorine and reaches the end of the distribution network at 0.05 mg/L or more — enough to damage fish gills and to inhibit ammonia-oxidising bacteria, the part of the nitrification system least able to spare them. This article reviews that harm, then measures how quickly three approaches actually clear it. Activated carbon was by far the quickest: 200 g in 36 L took residual chlorine from 0.61 mg/L to zero in 35 minutes. Standing under indoor light alone was the slowest — three samples starting near 0.58 mg/L still held 0.02 mg/L after 4 hours 38 minutes. Adding aeration helped but inconsistently: one sample was down to 0.06 mg/L within 80 minutes while the other two tracked the light-only curves. Vitamin C and sodium thiosulfate are covered by principle only and were not measured here. The measured curves live in the figures rather than in the text, and the runs differ in starting concentration and volume, so read them as timescales rather than as a head-to-head ranking.
Review
Comparative Evaluation of Artemia salina Nauplii from Four Commercial Brands: Salinity, Parasites and Bacterial Load
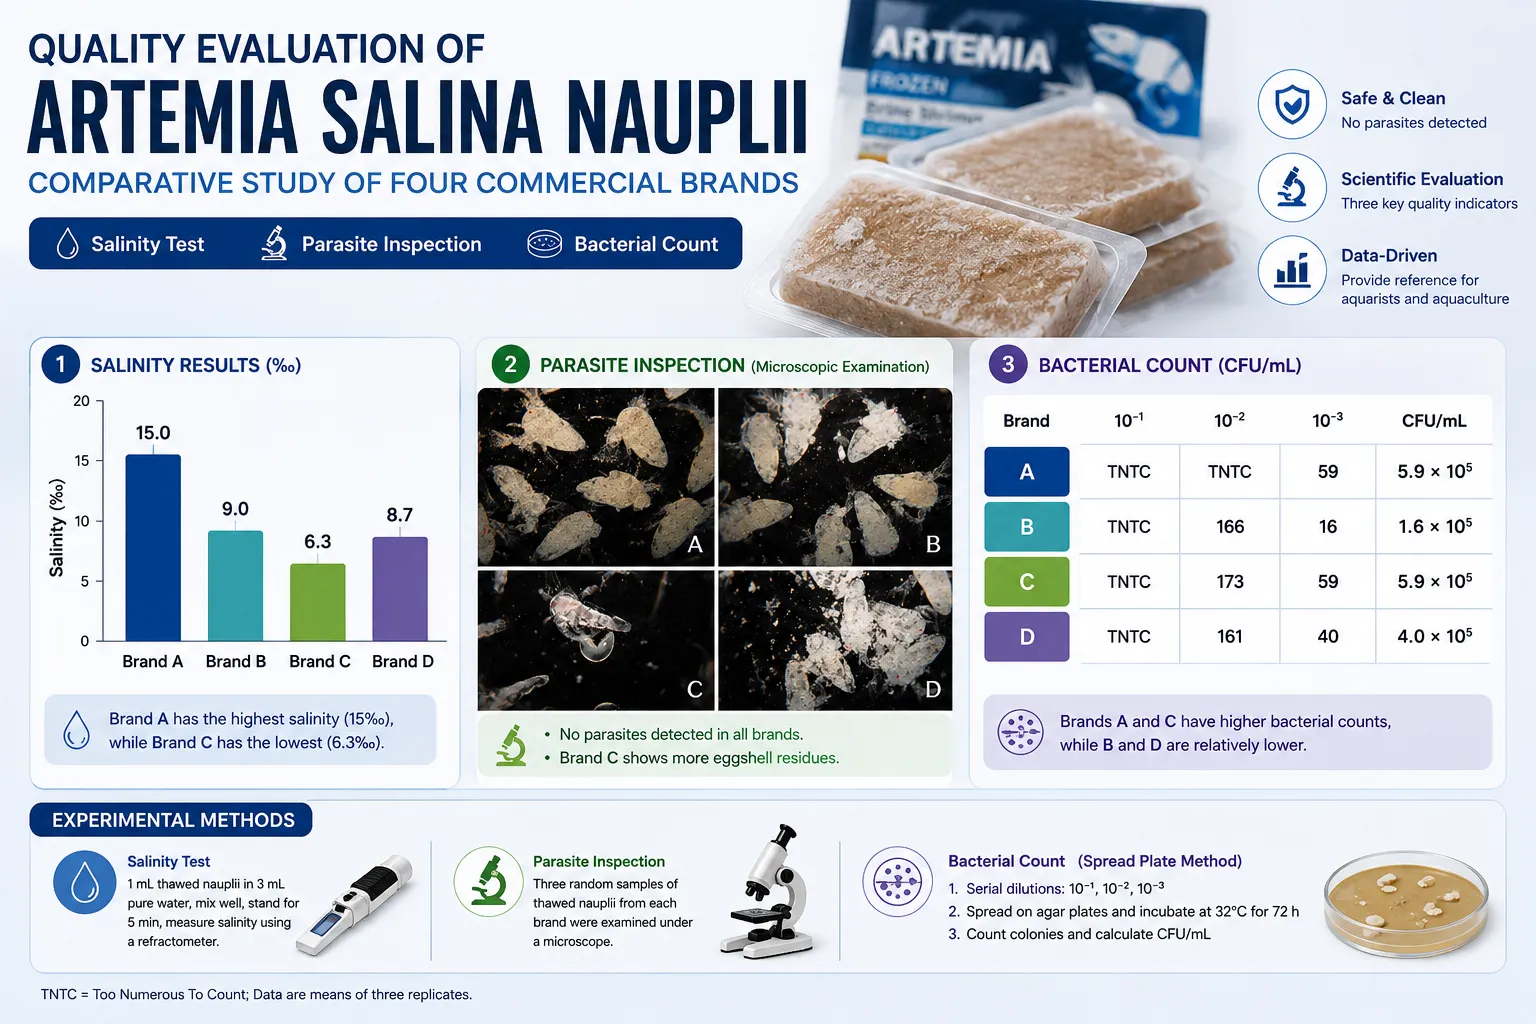
Four commercial brands of Artemia salina nauplii were tested for salinity, parasites and bacterial load. No parasites were found in any brand, so the basic sanitary claims hold up. But every brand carried bacteria of the same order of magnitude — from 1.6×10⁵ CFU/mL for the lowest to 5.9×10⁵ CFU/mL for the highest — suggesting that "fully disinfected" marketing does not survive storage and transport. Salinity varied more than expected, from 15‰ down to 6.3‰, and the lowest-salinity brand also showed heavy chorion residue and visible blank ice, pointing to high water content and incomplete processing. At the dilution actually used when feeding, the salt added to tank water is negligible. Three replicates per brand, cultivable bacteria only, and brands are anonymised as A–D.
Research
Effects of Water Exchange Frequency on Water Quality and Aquatic Plant Growth in Planted Tanks
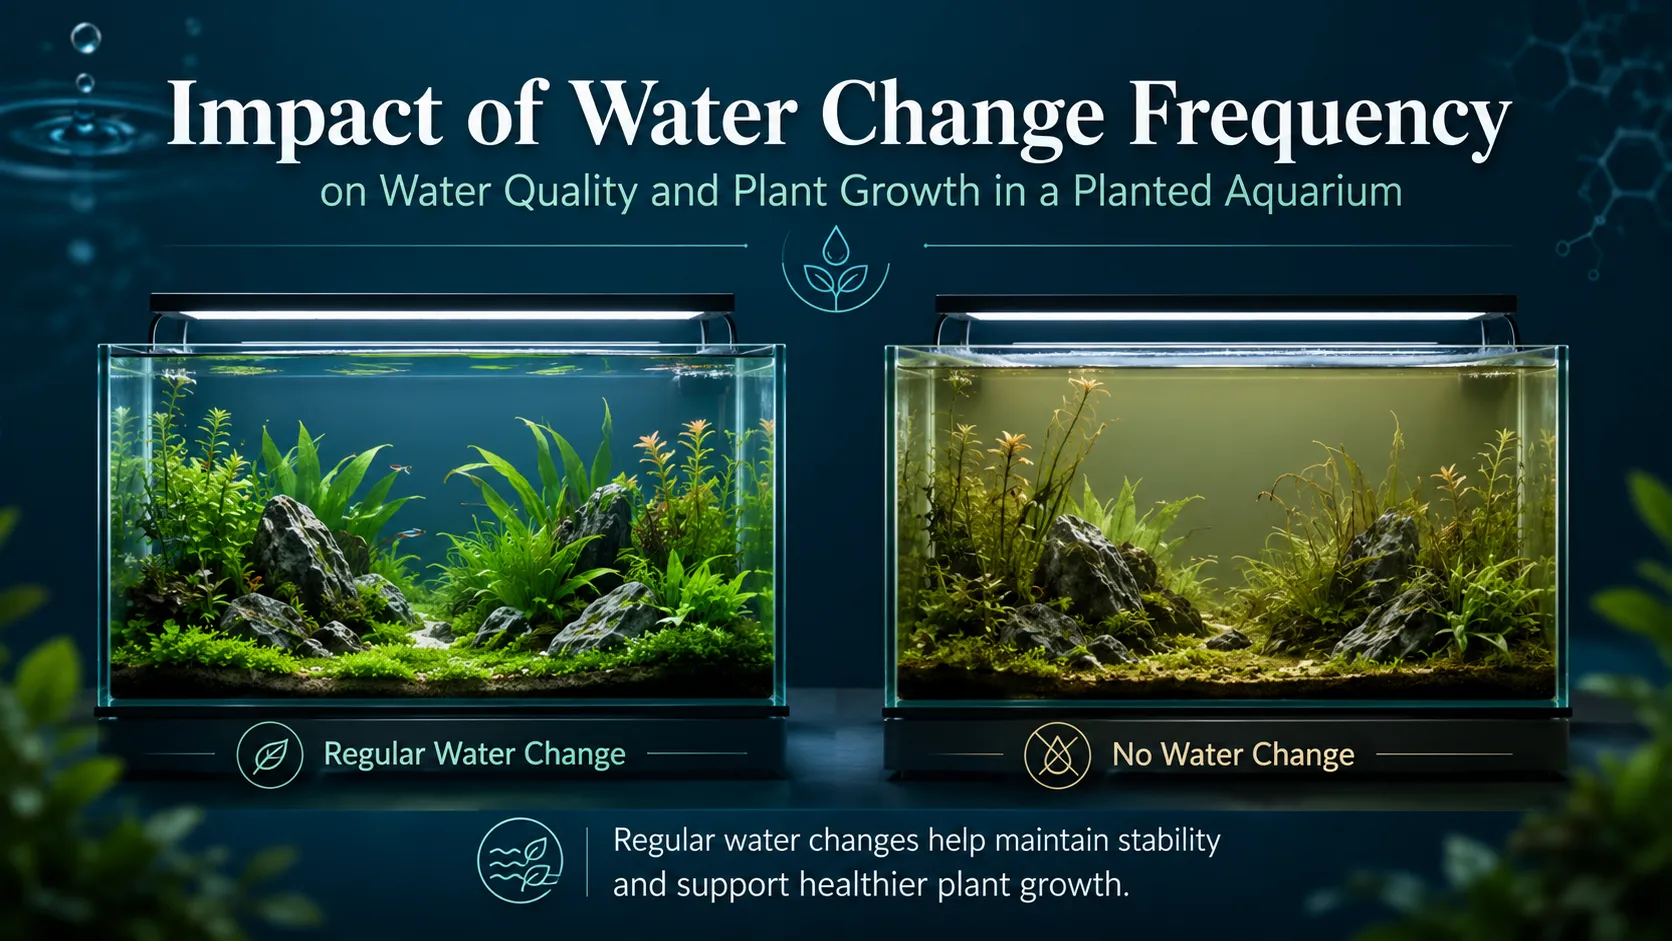
Two identical 30 cm planted tanks ran for eight weeks under matched light, feeding and filtration — one given a one-third water change every seven days, the other none at all. pH, nitrate and TDS tracked each other closely in both. Phosphate did not: it climbed from 1.55 to 4.18 mg/L without water changes, against a 3.56 mg/L peak that fell away after week 5 with them, and the untouched tank's water yellowed visibly from week 4. Brown algae and black beard algae appeared in both, at much the same time and coverage. Most plants changed little either way, though Rotala macrandra grew better in the tank receiving changes. Over eight weeks the unchanged tank did not settle into a more stable system than the maintained one. One tank per treatment (n=1), so these are descriptive trends, not statistically general conclusions.
Research
Glutaraldehyde for Removing Black Beard Algae: What Concentration Is Truly Effective?
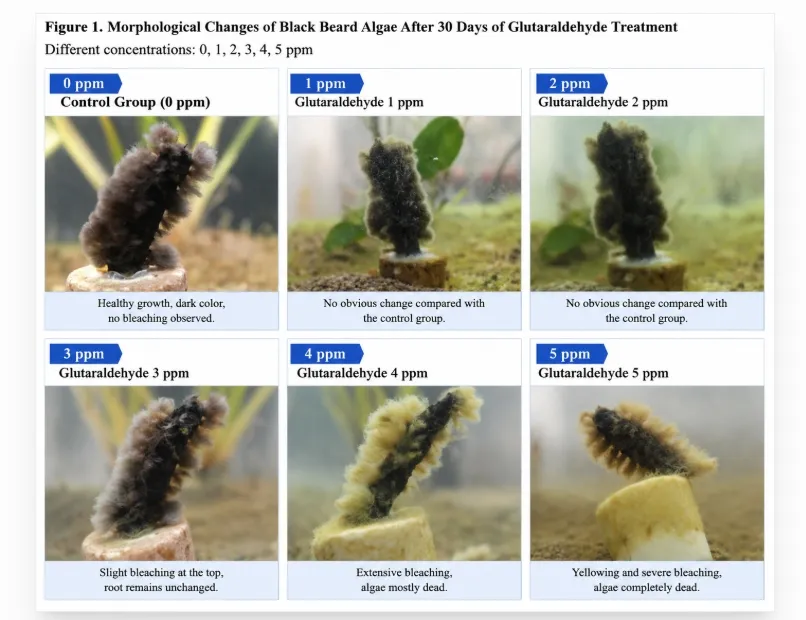
Six glutaraldehyde concentrations — 0, 1, 2, 3, 4 and 5 ppm — were dosed daily for 30 days in matched 20 L tanks holding black beard algae, three aquatic plant species and zebrafish. The algae were unchanged at 1–2 ppm, showed slight whitening at the tips at 3 ppm, and whitened and died extensively at 4–5 ppm. But Vallisneria had already yellowed slightly at 2 ppm and was obviously yellowing and decaying by 3 ppm, while Echinodorus major and Anubias showed no visible damage anywhere in the range. The dose that clears the algae and the dose a sensitive plant tolerates therefore overlap, and no safe whole-tank window emerged. One tank per concentration, no parallel replicates, and residual glutaraldehyde was never measured — these are nominal dosing concentrations and trend observations, not a dosing recommendation.
Research
Investigation of the Effect of Filter Media Volume on Aquarium Nitrification Efficiency
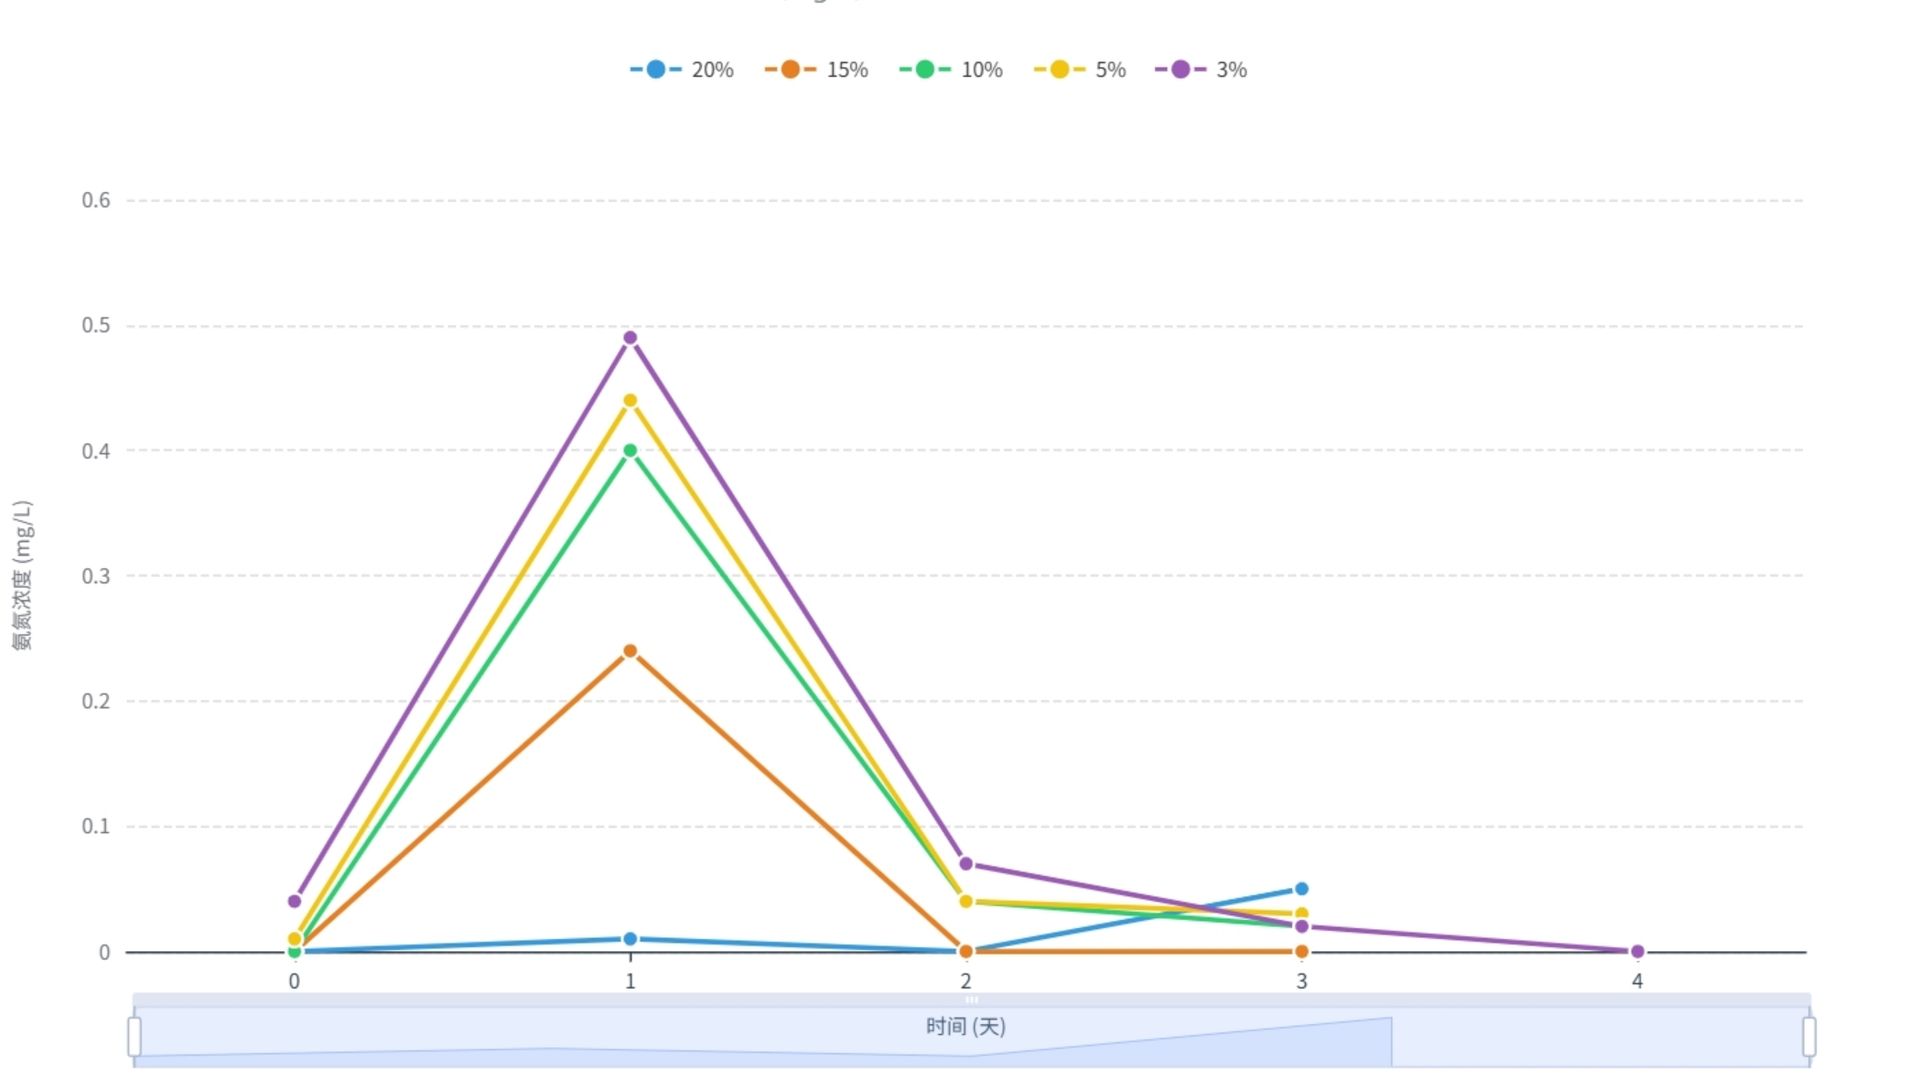
A sump-filtered 220 L aquarium stocked with 45 fish was given an 18 g overfeeding load at five filter media ratios — 20%, 15%, 10%, 5% and 3% of water volume — measuring how long ammonia nitrogen and nitrite took to return to safe values. A higher ratio lowered both peaks, but at 5% and above the differences in recovery time were limited and every group held stable nitrification; only the 3% group lagged, by roughly one day on nitrite. Each ratio was run once, in sequence in the same system with no parallel replicates, so this is a configuration guide for medium- to low-load home aquariums rather than a validated optimum.
Research
Study on Leaching Characteristics of Phthalates from 3D Printing Filaments in Freshwater and Seawater
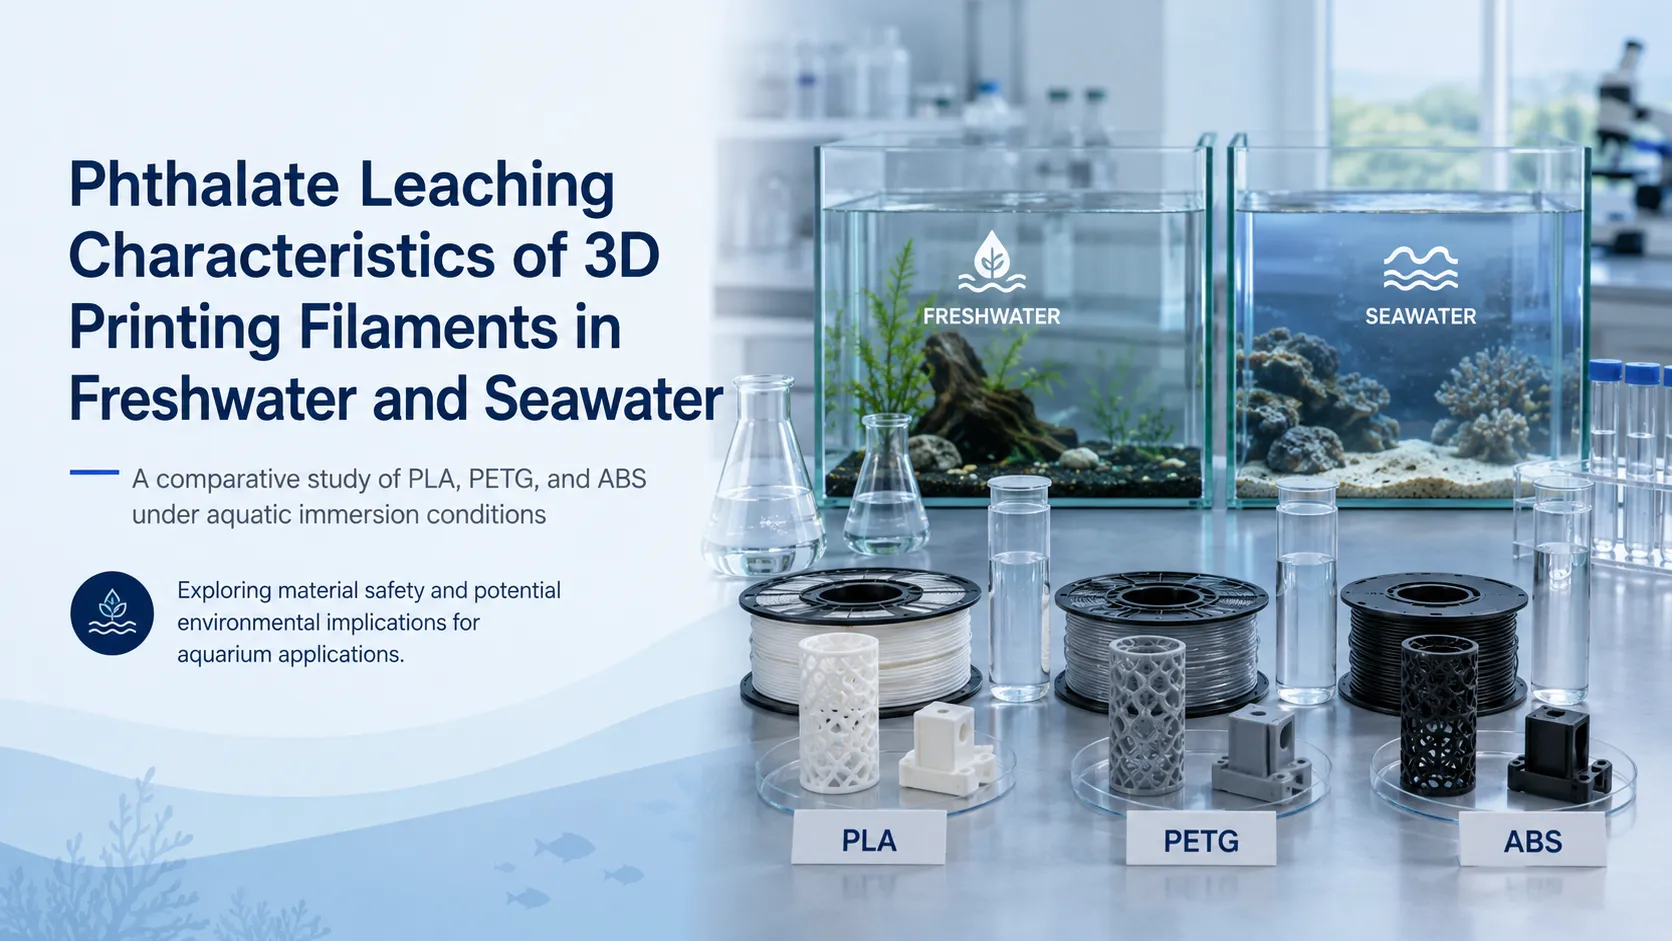
A laboratory study of phthalate leaching from three common 3D printing filaments — PLA, PETG and ABS — after 10 days of static immersion in freshwater and artificial seawater. Of the four target compounds (DMP, DEP, DBP and DOP), only DOP was detected, at 0.019–0.026 mg·L⁻¹ — including in the blank controls, which points to background contamination rather than release from the filaments. Under these short-term conditions no remarkable release of the target phthalates was observed; longer-term, multi-condition testing and further methodological validation are still required.