
Research
Glutaraldehyde for Removing Black Beard Algae: What Concentration Is Truly Effective?
Six glutaraldehyde concentrations — 0, 1, 2, 3, 4 and 5 ppm — were dosed daily for 30 days in matched 20 L tanks holding black beard algae, three aquatic plant species and zebrafish. The algae were unchanged at 1–2 ppm, showed slight whitening at the tips at 3 ppm, and whitened and died extensively at 4–5 ppm. But Vallisneria had already yellowed slightly at 2 ppm and was obviously yellowing and decaying by 3 ppm, while Echinodorus major and Anubias showed no visible damage anywhere in the range. The dose that clears the algae and the dose a sensitive plant tolerates therefore overlap, and no safe whole-tank window emerged. One tank per concentration, no parallel replicates, and residual glutaraldehyde was never measured — these are nominal dosing concentrations and trend observations, not a dosing recommendation.
By Dylan Li · 8/17/2026
Key findings
- Glutaraldehyde was dosed daily for 30 days at 0, 1, 2, 3, 4 and 5 ppm in matched 20 L tanks, each holding black beard algae, Echinodorus major, Vallisneria, Anubias and zebrafish (1.3-1.5).
- Black beard algae were unchanged at 1-2 ppm, showed slight whitening at the tips at 3 ppm, and whitened, yellowed and died extensively at 4-5 ppm. Approximately 4 ppm is where obvious death began (2.1, 3.1).
- Vallisneria was already slightly yellowed at 2 ppm and obviously yellowing and decaying at 3 ppm, while Echinodorus major and Anubias showed no visible damage anywhere in the 0-5 ppm range. The dose that clears the algae and the dose a sensitive plant tolerates overlap, so no safe whole-tank window was found (2.2, 3.2, 3.3, 4).
- No obvious adverse reactions were recorded in zebrafish at any concentration. That is an observation under these conditions only. It is not a finding that 5 ppm is safe for fish, and it does not extend to shrimp, snails or other aquatic organisms (3.6).
- Limitations: one tank per concentration with no parallel replicates; removal was judged by visible colour change rather than biomass or coverage; residual glutaraldehyde in the water was never measured, so 1-5 ppm are nominal dosing concentrations. This is not a dosing recommendation (3.7).
Abstract
To investigate the removal effect of different glutaraldehyde concentrations on black beard algae and their effects on aquatic plants and fish, this experiment established six glutaraldehyde concentration gradients: 0, 1, 2, 3, 4, and 5 ppm. Black beard algae, Echinodorus major, Vallisneria, and Anubias were used as the main observation subjects, and zebrafish were stocked in the experimental tanks. The observation period lasted 30 days. During the experiment, the growth status of black beard algae and aquatic plants, fish responses, and water quality indicators were monitored, including water temperature, dissolved oxygen, pH, KH, GH, ammonia nitrogen, nitrite, nitrate, phosphate, and electrical conductivity. The results showed that at 1–2 ppm glutaraldehyde, black beard algae showed no obvious changes by the end of the 30-day observation period. In the 3 ppm treatment group, slight whitening appeared at the tips of the black beard algae, but Vallisneria had already shown obvious yellowing and decay. In the 4–5 ppm nominal concentration groups, black beard algae showed obvious whitening, yellowing, and death, indicating a clear removal effect; however, Vallisneria was also severely damaged. In contrast, Echinodorus major and Anubias showed no obvious visible damage in any treatment group, and zebrafish showed no obvious adverse reactions. Under the conditions of this experiment, approximately 4 ppm can be regarded as the effective concentration at which black beard algae began to show obvious death, but this concentration already caused visible damage to some sensitive aquatic plants. Therefore, 4–5 ppm should not simply be used as a safe recommended concentration for whole-tank use in planted aquariums. In practical application, glutaraldehyde use should comprehensively consider algae removal efficacy, aquatic plant species, and tolerance differences, while reducing potential damage to aquatic plants during black beard algae control.
Keywords: glutaraldehyde; black beard algae; aquatic plants; algae removal; concentration; aquarium
Introduction
Black beard algae are one of the common and difficult-to-control attached algae in planted aquariums. They often attach to aquatic plant leaves, driftwood, stones, and filtration equipment surfaces. Once black beard algae proliferate in large quantities, they not only affect the overall viewing quality of the aquarium but may also cover aquatic plant leaves and interfere with normal plant growth. Therefore, how to effectively control black beard algae while minimizing impacts on aquatic plants and other aquatic organisms is an important issue in daily planted aquarium maintenance. Multiple epiphytic freshwater red algae have been detected in aquarium systems, and DNA barcoding surveys have also shown that some freshwater red algae can enter and spread through aquarium systems via ornamental aquatic plants and aquatic animals [1].
In practical aquarium maintenance, glutaraldehyde is often used to assist in controlling black beard algae. However, its efficacy is closely related to concentration: when the concentration is too low, it may be difficult to produce a visible effect on black beard algae within a short period; as the concentration increases, algae removal efficacy may improve, but different aquatic plant species may also be affected to varying degrees. Therefore, evaluating whether a given concentration is suitable for use in a planted aquarium cannot rely solely on whether black beard algae die. Glutaraldehyde itself is a widely used biocide, and aquatic ecotoxicology studies have shown that its effects on algae, crustaceans, and fish differ significantly with concentration and species [2–4].
Based on this, this experiment established six glutaraldehyde concentration gradients: 0, 1, 2, 3, 4, and 5 ppm. Under identical culture conditions, a 30-day observation experiment was conducted. Changes in the color and growth status of black beard algae were used as the main indicators of algae removal efficacy. At the same time, Echinodorus major, Vallisneria, and Anubias were selected to observe plant tolerance, while zebrafish responses and relevant water quality changes were recorded. By comparing differences among treatment groups, the relationship between glutaraldehyde concentration, black beard algae removal efficacy, and aquatic plant tolerance was analyzed.
This experiment aimed to determine the practical effective range of different glutaraldehyde concentrations against black beard algae, and to focus on evaluating the possible effects on different aquatic plants when obvious algae removal effects appear, providing an experimental reference for the rational use of glutaraldehyde in planted aquariums.
1. Materials and Methods
1.1 Experimental Materials
Six glass aquariums measuring 30 cm × 30 cm × 30 cm were used as experimental tanks. Black beard algae were collected from an aquarium with existing black beard algae growth, and water from the original aquarium was used as one source of experimental water. The tested aquatic plants were Echinodorus major, Vallisneria, and Anubias, and the tested fish species was zebrafish.
The main experimental materials and equipment are listed below:
Category | Material or equipment |
|---|---|
Experimental tank | 30 cm × 30 cm × 30 cm glass aquarium |
Tested algae | Black beard algae |
Tested aquatic plants | Echinodorus major, Vallisneria, Anubias |
Tested fish | Zebrafish |
Treatment reagent | Glutaraldehyde |
Filtration equipment | Hang-on-back filter |
Filter media | Mature aquarium ceramic rings |
Water quality monitoring equipment | Online temperature sensor, online pH sensor, conductivity meter |
Water quality test reagents | GH test reagent, KH test kit, phosphate reagent kit, nitrate reagent kit |
Analytical equipment | Spectrophotometer |
Aquatic plant monitoring | Chlorophyll meter and chlorophyll reagent kit |
Pipetting equipment | 1 mL pipette and matching tips |
The glutaraldehyde used in the experiment was dosed according to the actual water volume of each experimental tank, so that the nominal treatment concentrations of each group were set at 1, 2, 3, 4, and 5 ppm.
1.2 Pretreatment of Black Beard Algae and Aquatic Plants
Before the experiment, black beard algae collected from the original aquarium were transferred into the experimental tanks and cultured under normal lighting and water flow conditions for approximately one week to adapt to the experimental environment.
The tested aquatic plants were cleaned before the experiment to remove surface debris and then placed in the experimental tanks for continued culture. The formal experiment began after they had returned to normal growth status.
1.3 Experimental Groups
A total of six treatment groups were established, including one blank control group and five glutaraldehyde concentration treatment groups:
Group | Nominal glutaraldehyde treatment concentration |
|---|---|
Control group | 0 ppm |
Experimental group 1 | 1 ppm |
Experimental group 2 | 2 ppm |
Experimental group 3 | 3 ppm |
Experimental group 4 | 4 ppm |
Experimental group 5 | 5 ppm |
No glutaraldehyde was added to the control group. The other experimental groups were dosed daily according to the set nominal treatment concentrations.
1.4 Experimental System Setup
Each experimental tank contained approximately 4 L of substrate and 20 L of water from the black beard algae source aquarium. Black beard algae and three aquatic plant species were added to each tank. Each tank contained one Echinodorus major, two Vallisneria plants, and one Anubias plant.
All experimental tanks used hang-on-back filters of the same specification, with a power of 5 W and a nominal flow rate of 280 L/h. Each filter contained 40 ceramic rings from a mature aquarium, and 10 zebrafish were placed in each experimental tank.
After the experimental system was set up, the filtration equipment was started to maintain continuous water circulation in each tank.
1.5 Glutaraldehyde Treatment and Daily Maintenance
The glutaraldehyde dosage was calculated according to the water volume of each experimental tank, and each treatment group was dosed daily according to the set nominal treatment concentration.
Unified daily maintenance conditions were maintained during the experiment:
- Approximately 1/3 water change each week;
- Feeding twice per week;
- Approximately 0.2 g of feed per feeding;
- Continuous operation of the filtration system in all experimental tanks.
The entire experimental period lasted 30 days.
During the experiment, the color, growth status, and changes such as whitening, yellowing, or death of black beard algae were observed and recorded daily.
When black beard algae in a given experimental group showed obvious death, the corresponding glutaraldehyde concentration and treatment duration were recorded, and glutaraldehyde dosing in that group was stopped. The lower-concentration treatment groups continued in order to observe whether prolonged exposure to low-concentration glutaraldehyde would affect black beard algae.
1.6 Observation of Aquatic Plant and Fish Status
During the experiment, the effects of different glutaraldehyde concentrations on aquatic plants were observed at the same time. Leaf color, growth status, yellowing, and decay of Echinodorus major, Vallisneria, and Anubias were recorded.
The activity and health status of zebrafish in each experimental tank were also observed daily, and any obvious adverse reactions or mortality were recorded.
1.7 Water Quality Monitoring
During the experiment, online temperature probes and pH electrodes were installed to monitor water temperature and pH in each experimental tank. Other water quality indicators were recorded manually.
The main monitoring items included:
- Water temperature;
- Dissolved oxygen (DO);
- pH;
- KH;
- GH;
- Ammonia nitrogen;
- Nitrite;
- Nitrate;
- Phosphate;
- Electrical conductivity.
Experimental data were recorded from March 25, 2025 to April 25, 2025. Water quality changes, black beard algae status, aquatic plant status, and fish responses in different glutaraldehyde concentration treatment groups were recorded and compared.
2. Experimental Results
2.1 Effects of Different Glutaraldehyde Concentrations on Black Beard Algae
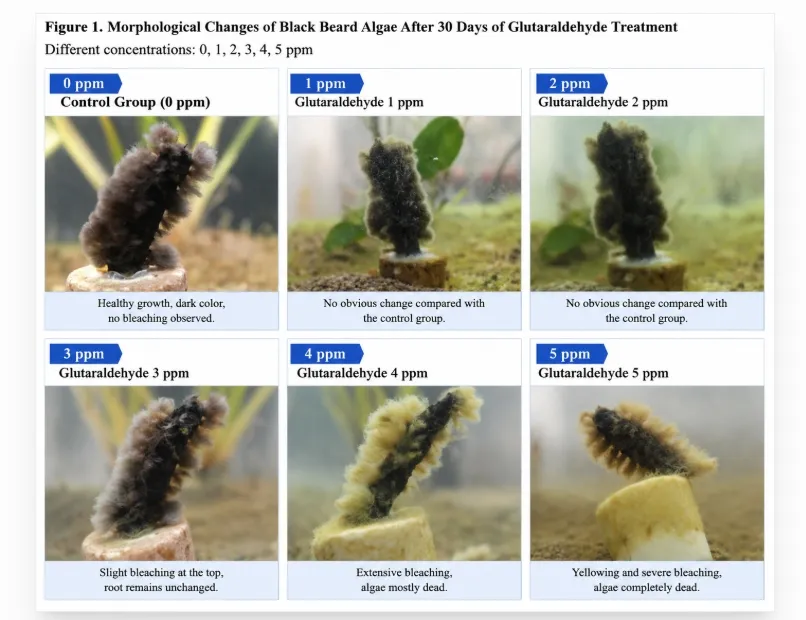
After 30 days of observation, different glutaraldehyde concentrations showed clearly different effects on black beard algae.
In the 0 ppm control group, black beard algae still maintained normal growth at the end of the experiment, with a darker color and no obvious whitening or death observed. The 1 ppm and 2 ppm treatment groups showed overall performance similar to the control group, and black beard algae showed no obvious changes after 30 days.
When the glutaraldehyde concentration increased to 3 ppm, black beard algae began to show certain changes. At the end of the experiment, slight whitening could be observed at the tips of the black beard algae, while the base showed no obvious changes. This indicated that 3 ppm treatment had begun to exert a visible effect on black beard algae, but the overall effect was still weak.
The 4 ppm treatment group showed more obvious changes. After 30 days, black beard algae showed extensive whitening and death, representing the first clear large-scale death observed in this experiment.
In the 5 ppm treatment group, black beard algae also showed obvious changes, gradually turning yellow and dying by the end of the experiment.
The changes in black beard algae after different concentration treatments are summarized below:
Glutaraldehyde concentration | Black beard algae status after 30 d | Algae removal performance |
|---|---|---|
0 ppm | Normal growth, darker color | None |
1 ppm | No obvious change | Not obvious |
2 ppm | No obvious change | Not obvious |
3 ppm | Slight whitening at the tips; no obvious change at the base | Effect begins to appear |
4 ppm | Extensive whitening and death | Obvious |
5 ppm | Yellowing and death | Obvious |
Overall, as the nominal glutaraldehyde treatment concentration increased, the effect on black beard algae gradually intensified. The 1–2 ppm groups showed no obvious removal effect by the end of the 30-day observation period; the 3 ppm group began to show slight whitening; and when the nominal treatment concentration reached 4–5 ppm, black beard algae showed obvious death.
Figure 1. Appearance changes of black beard algae after 30 d of treatment with different glutaraldehyde concentrations
2.2 Effects of Different Glutaraldehyde Concentrations on Aquatic Plants
This experiment also observed the growth status of three aquatic plants—Echinodorus major, Vallisneria, and Anubias—under different glutaraldehyde concentrations.
2.2.1 Echinodorus major
In the 0–5 ppm treatment groups, Echinodorus major maintained relatively stable overall growth status.
At the end of the experiment, no obvious yellowing, decay, or other severe damage was recorded in the leaves of Echinodorus major in any group.
Therefore, during the 30-day observation period of this experiment, no obvious visible damage caused by 1–5 ppm glutaraldehyde was observed in Echinodorus major.
2.2.2 Vallisneria
Compared with Echinodorus major, Vallisneria showed more obvious concentration-related changes in response to glutaraldehyde.
In the 0 ppm control group, Vallisneria maintained normal growth, with darker leaf color.
After 30 days of 1 ppm treatment, the leaves of Vallisneria showed slight color changes.
When the concentration increased to 2 ppm, Vallisneria leaves began to show slight yellowing.
In the 3 ppm treatment group, Vallisneria damage further increased, and obvious yellowing and decay appeared at the end of the experiment.
In the 4 ppm treatment group, Vallisneria also showed obvious yellowing and relatively severe damage. In the 5 ppm treatment group, leaf damage was more obvious, with yellowing and decay.
The treatment results for Vallisneria at different concentrations can be summarized as follows:
Glutaraldehyde concentration | Vallisneria status after 30 d |
|---|---|
0 ppm | Normal growth |
1 ppm | Slight leaf color change |
2 ppm | Slight yellowing |
3 ppm | Obvious yellowing and decay; severe damage |
4 ppm | Obvious leaf yellowing; severe damage |
5 ppm | Severe damage; leaf yellowing and decay |
The results showed that among the three tested aquatic plants, Vallisneria showed the most obvious changes, and the degree of leaf damage generally increased as the glutaraldehyde concentration increased.
2.2.3 Anubias
Anubias remained relatively stable throughout the experiment.
At the end of the experiment, Anubias in the 0–5 ppm treatment groups was recorded as maintaining good growth status and darker leaf color, without obvious yellowing or decay similar to Vallisneria. Therefore, based on the 30-day visible observation results of this experiment, different aquatic plants showed obvious differences in response to glutaraldehyde treatment, with Vallisneria showing the most obvious changes, while Echinodorus major and Anubias were relatively stable.
2.3 Effects of Different Glutaraldehyde Concentrations on Zebrafish
The activity status of zebrafish and whether they showed abnormal reactions were continuously observed during the experiment.
No obvious adverse reactions were observed in any of the 0–5 ppm treatment groups according to the experimental records, and no obvious fish abnormalities caused by glutaraldehyde treatment were recorded during the 30-day experiment.
Therefore, under the conditions and observation period of this experiment, 1–5 ppm glutaraldehyde treatment did not produce obvious adverse reactions in zebrafish.
It should be noted that this result only reflects the zebrafish, experimental water body, and treatment method used in this experiment, and cannot directly represent the same tolerance in other fish or aquatic organisms at the same concentrations.
2.4 Water Quality Changes in Different Concentration Treatment Groups
During the experiment, water temperature, dissolved oxygen (DO), pH, KH, GH, ammonia nitrogen, nitrite, nitrate, phosphate, and electrical conductivity were monitored in each treatment group.
The overall water temperature trends of all experimental groups were similar. In the early stage, temperature was approximately 21.6–22.0 ℃; on Day 7, it was approximately 19.8–20.2 ℃; and then gradually increased to approximately 23.0–24.1 ℃ on Day 21.
During the experiment, ammonia nitrogen and nitrite generally remained at relatively low levels in all groups, although some fluctuations still existed among different treatment groups.
In the 4 ppm treatment group, ammonia nitrogen changed from 0.00 mg/L at the beginning of the experiment to 0.07 mg/L on Day 21; nitrite was 0.012 mg/L during the same period.
In the 5 ppm treatment group, ammonia nitrogen was 0.01 mg/L on Day 21, and nitrite was 0.012 mg/L.
For dissolved oxygen, measured values in some high-concentration treatment groups in the later stage of the experiment were lower than the initial values. On Day 21:
Glutaraldehyde concentration | DO (mg/L) |
|---|---|
0 ppm | 9.36 |
1 ppm | 8.27 |
2 ppm | 8.43 |
3 ppm | 8.03 |
4 ppm | 7.74 |
5 ppm | 7.96 |
The monitoring results showed that DO values in the 3–5 ppm treatment groups on Day 21 were lower than those in the control group during the same period. However, the existing data in this experiment were mainly used to describe water quality changes under different treatment conditions and are not sufficient by themselves to prove that this change was directly caused by glutaraldehyde.
Based on the observations of black beard algae, aquatic plants, and fish, as glutaraldehyde concentration increased from 1 ppm to 5 ppm, the effect on black beard algae gradually intensified. At the same time, Vallisneria damage also gradually increased, while Echinodorus major, Anubias, and zebrafish did not show equally obvious abnormalities under the observation conditions of this experiment.
3. Discussion
3.1 The Effect of Glutaraldehyde on Black Beard Algae Shows Clear Concentration Differences
The results of this experiment showed that during the 30-day observation period, black beard algae responded differently to different glutaraldehyde concentrations. In the 1 ppm and 2 ppm treatment groups, no obvious changes were observed in black beard algae. When the concentration increased to 3 ppm, the tips of black beard algae began to show slight whitening. When the nominal treatment concentration reached 4–5 ppm, black beard algae showed extensive whitening, yellowing, and death. This indicates that within the 1–5 ppm range set in this experiment, the effect on black beard algae generally increased as the glutaraldehyde concentration increased.
It is worth noting that although 3 ppm had already caused whitening at the tips of the black beard algae, no obvious changes were observed at the base, indicating that black beard algae were affected to some extent at this concentration, but the overall removal effect was still limited. In contrast, extensive whitening and death of black beard algae were first observed after 4 ppm treatment. Therefore, based on visible observation results in this experiment, approximately 4 ppm can be regarded as the concentration range at which obvious algae removal effects begin to appear.
From a chemical perspective, glutaraldehyde can react with amino groups in proteins and form crosslinks, which is one of the important chemical bases for its broad-spectrum biocidal activity [5]. However, this experiment did not directly measure changes in black beard algae cell structure, protein content, or enzyme activity. Therefore, this mechanism can only be used as literature background to explain the experimental phenomena, and cannot be used to determine the specific mechanism of black beard algae whitening and death.
However, the term “effective concentration” here cannot be directly equated with the “optimal use concentration” in actual planted aquariums. Determining whether an algae removal treatment is suitable for use in a planted aquarium also requires consideration of its effects on aquatic plants, fish, and the overall aquatic environment.
3.2 Some Aquatic Plants Were Damaged Before Obvious Death of Black Beard Algae Occurred
One important result of this experiment is that Vallisneria showed obvious damage at a lower concentration than the concentration at which black beard algae showed obvious death.
After 1 ppm treatment, Vallisneria leaves already showed slight color changes. At 2 ppm, slight yellowing appeared. When the concentration reached 3 ppm, Vallisneria had already shown obvious yellowing and decay. At the same time, black beard algae in the 3 ppm treatment group only showed slight whitening at the tips and had not yet shown obvious death.
When the concentration increased to 4–5 ppm, although black beard algae showed obvious death, Vallisneria damage also further increased, with obvious leaf yellowing and partial leaf decay.
Therefore, this experiment did not identify an ideal “algae removal–plant safety window.”
If the judgment is based only on whether black beard algae die, 4–5 ppm showed the most obvious effect. However, when plant safety is also considered, Vallisneria had already suffered relatively severe damage before this algae removal concentration was reached.
Therefore, directly defining 4 ppm as the “optimal glutaraldehyde concentration” would not be rigorous. A more appropriate statement would be:
Under the conditions of this experiment, 4–5 ppm is the effective concentration range in which black beard algae show obvious death, but this concentration may also cause obvious damage to some sensitive aquatic plants.
3.3 Different Aquatic Plants Show Clearly Different Tolerance to Glutaraldehyde
The three tested aquatic plants did not respond consistently to glutaraldehyde.
Among them, Vallisneria showed the most obvious changes, and as treatment concentration increased, the degree of leaf yellowing and decay gradually intensified.
In contrast, Echinodorus major and Anubias remained relatively stable in all 0–5 ppm treatment groups. At the end of the 30-day experiment, neither species was recorded as showing extensive yellowing or decay similar to Vallisneria. Especially when black beard algae had already died significantly and Vallisneria was severely damaged in the 4–5 ppm groups, Echinodorus major and Anubias still maintained relatively normal visible status.
This result indicates that different aquatic plant species may differ greatly in their tolerance to glutaraldehyde treatment.
Previous studies have also found significant sensitivity differences among different aquatic organisms and life stages in response to glutaraldehyde [2–3], which is broadly consistent with the different tolerance patterns observed among aquatic plants in this experiment. However, because the tested species and exposure methods differ, literature data cannot be directly used to calculate safety thresholds for the aquatic plants in this experiment.
Therefore, when discussing the use concentration of glutaraldehyde in planted aquariums, it is not appropriate to provide a single uniform value applicable to all aquatic plants. A concentration that causes no obvious visible damage to Echinodorus major or Anubias does not mean it is equally safe for Vallisneria or other aquatic plants.
For mixed planted aquariums containing multiple aquatic plant species, it is especially necessary to consider the species with relatively lower tolerance rather than judging overall safety based only on more tolerant species.
It should be noted that this experiment mainly evaluated aquatic plant status based on visible changes such as leaf color, yellowing, and decay, and cannot yet establish precise tolerance thresholds for different aquatic plants. Therefore, this experiment can demonstrate clear differences among the three tested aquatic plants, but the specific tolerance concentrations still require further experimental verification.
3.4 Long-Term 1–2 ppm Treatment Did Not Show Obvious Removal Effects on Black Beard Algae
The low-concentration treatment groups also provide useful reference value.
After continuous treatment with 1 ppm and 2 ppm glutaraldehyde for 30 days, black beard algae still showed no obvious changes. In other words, under the treatment method and experimental conditions of this experiment, simply extending the treatment duration at 1–2 ppm did not produce a removal effect similar to that of 4–5 ppm.
In particular, in the 2 ppm treatment group, black beard algae had not yet shown obvious changes, but Vallisneria had already shown slight yellowing.
This further indicates that in this experimental system, using a relatively low concentration for an extended period did not produce the ideal effect of “gradually removing black beard algae while protecting aquatic plants.”
However, this experiment used a whole-tank method in which glutaraldehyde was added daily according to the set nominal treatment concentration. Therefore, these results mainly apply to the treatment method used in this experiment and cannot directly determine the efficacy of spot dosing, short-term high-concentration treatment, or other dosing methods.
3.5 Water Quality Changes During Glutaraldehyde Treatment
During the experiment, the overall water temperature trends of all groups were relatively similar, and ammonia nitrogen and nitrite remained at relatively low levels most of the time. This indicates that under the conditions of this experiment, the experimental tanks did not show clear, consistent, severe deterioration in water quality during the 30-day observation period.
However, some high-concentration treatment groups still showed changes worth noting.
For example, in the 4 ppm treatment group, ammonia nitrogen reached 0.07 mg/L on Day 21, higher than the initial 0.00–0.02 mg/L of that group.
For dissolved oxygen, on Day 21, the DO of the 0 ppm control group was 9.36 mg/L, while the 3 ppm, 4 ppm, and 5 ppm treatment groups were 8.03, 7.74, and 7.96 mg/L, respectively.
From the data pattern, DO in the high-concentration treatment groups was lower than that in the control group during the same period in the later stage of the experiment. However, because each concentration corresponded to only one experimental tank, and because aquatic plant status, black beard algae status, biological respiration, and water body changes may all affect DO, the existing experiment cannot prove that the DO decline was directly caused by glutaraldehyde.
Similarly, the ammonia nitrogen increase in the 4 ppm group on Day 21 should currently be regarded only as an observed phenomenon during the experiment and should not be directly interpreted as inhibition of the nitrification system by glutaraldehyde.
Therefore, water quality changes in this experiment are more suitable for descriptive analysis, and clear causal relationships should not be established based on single time-point data.
3.6 No Obvious Abnormalities Were Observed in Zebrafish Under 0–5 ppm Treatment, but This Cannot Be Directly Extrapolated to Other Organisms
During the experiment, no obvious adverse reactions were recorded in zebrafish in any of the 0–5 ppm treatment groups. Even in the 4 ppm and 5 ppm groups, where black beard algae had clearly died and Vallisneria was visibly damaged, zebrafish in the experimental records still showed no obvious abnormalities.
Therefore, under the water conditions, treatment period, and zebrafish conditions of this experiment, no obvious adverse reactions caused by 1–5 ppm glutaraldehyde were observed in zebrafish.
However, this result only indicates that “no obvious abnormalities were observed” in this experiment. It cannot be further concluded that “5 ppm is safe for fish.” In a study by Pereira et al. on multiple aquatic organisms, the 96 h LC50 for adult zebrafish was approximately 5.5 mg/L, and sublethal biomarker changes were also observed [3]. Therefore, the lack of visible abnormalities in the 5 ppm group in this experiment can only be described as an observation under the present experimental conditions and cannot be used to determine that this concentration is safe for zebrafish or other fish.
First, the only tested fish species in this experiment was zebrafish, and different fish species may differ in their tolerance to the same treatment conditions. Second, this experiment did not test shrimp, snails, or other aquatic organisms. Therefore, the fish observation results of this experiment cannot be directly extrapolated to the entire aquarium ecosystem.
3.7 Limitations of This Experiment
Although this experiment preliminarily observed the relationship between glutaraldehyde concentration and changes in black beard algae and aquatic plant status through a 0–5 ppm nominal concentration gradient, it still has certain limitations.
First, only one independent experimental tank was set up for each concentration, and no parallel replicates were included. Therefore, the current results are more suitable as trend observations under different concentrations and cannot yet support strict statistical comparison.
Second, the removal effect on black beard algae was mainly evaluated through visible changes such as color, whitening, and death. Biomass, chlorophyll content, or coverage area per unit area of black beard algae were not further measured, so the exact removal rate under different concentrations cannot yet be calculated.
Third, although the experiment set glutaraldehyde dosing concentrations at 1–5 ppm, the actual residual concentration of glutaraldehyde in the water was not directly measured during the experiment. Therefore, the 1–5 ppm values in this article mainly represent nominal treatment concentrations and cannot be equated with actual glutaraldehyde concentrations continuously maintained in the water throughout the treatment period.
A literature review shows that the stability of glutaraldehyde in aqueous phase can be affected by pH, temperature, and other conditions, and it can undergo biodegradation in freshwater environments [4]. Therefore, the nominal dosing concentrations in this article may not fully match the continuous exposure concentrations actually experienced by organisms during the experiment.
Fourth, this experiment only selected three aquatic plants—Echinodorus major, Vallisneria, and Anubias—and zebrafish as tested organisms. Therefore, the tolerance results obtained cannot represent all aquatic plants and aquatic animals.
Future experiments can include parallel replicates, further record black beard algae coverage area or biomass changes, and include more types of aquatic plants and other aquatic organisms to further determine the concentration range between glutaraldehyde algae removal efficacy and biological safety.
3.8 Practical Application Significance
Overall, the results of this experiment show that glutaraldehyde has a clear concentration-related effect on black beard algae.
Under the conditions of this experiment:
- 1–2 ppm: No obvious changes in black beard algae;
- 3 ppm: Slight whitening begins to appear in black beard algae, but Vallisneria has already been visibly damaged;
- 4–5 ppm: Black beard algae show obvious whitening, yellowing, and death, while Vallisneria simultaneously shows severe yellowing and decay.
Therefore, this experiment did not identify an ideal concentration that could simultaneously achieve “obvious black beard algae removal” and “good condition of all tested aquatic plants.”
Compared with simply searching for a so-called “best concentration,” the more important result of this experiment is that it shows the effective algae removal concentration and the tolerance concentration of sensitive aquatic plants may overlap or even conflict.
Therefore, in practical planted aquarium applications, the choice of glutaraldehyde concentration should not be judged only by algae removal efficacy, but should also consider the specific aquatic plant species in the aquarium and their tolerance.
Under the conditions of this experiment, approximately 4 ppm can be used as a reference concentration at which black beard algae begin to show obvious death, but it should not be directly defined as a safe recommended concentration for whole-tank use in planted aquariums.
4. Conclusions
This experiment established nominal glutaraldehyde treatment concentration gradients of 0, 1, 2, 3, 4, and 5 ppm, with an observation period of 30 days, to observe the effects of different glutaraldehyde concentrations on black beard algae, aquatic plants, and zebrafish. Based on the experimental results, the following conclusions can be drawn:
- The effect of glutaraldehyde on black beard algae increased with treatment concentration. After 30 days of 1–2 ppm treatment, black beard algae showed no obvious changes; after 3 ppm treatment, the tips of black beard algae began to show slight whitening; when the nominal treatment concentration reached 4–5 ppm, black beard algae showed obvious whitening, yellowing, and death, indicating a clear algae removal effect.
- Approximately 4 ppm can be regarded as the effective concentration at which black beard algae began to show obvious death under the conditions of this experiment. Compared with 1–3 ppm, the 4 ppm treatment group was the first to show extensive whitening and death of black beard algae, and the 5 ppm group also showed obvious death. Therefore, 4–5 ppm was the concentration range with relatively obvious algae removal efficacy in this experiment.
- Different aquatic plants showed clearly different tolerance to glutaraldehyde. Vallisneria was relatively sensitive to glutaraldehyde. Slight yellowing had already appeared at 2 ppm, and damage further increased at 3–5 ppm, with obvious yellowing or even decay. In contrast, Echinodorus major and Anubias showed no obvious visible damage within the 0–5 ppm treatment range of this experiment.
- There was a conflict between the effective algae removal concentration and the safe concentration for some sensitive aquatic plants. Before black beard algae reached obvious death, Vallisneria had already shown obvious damage. Therefore, although 4–5 ppm had a clear removal effect on black beard algae, it should not be directly defined as a safe optimal concentration applicable to all planted aquariums.
- Under the conditions of this experiment, no obvious adverse reactions were observed in zebrafish in any 0–5 ppm treatment group. However, this result only applies to the fish species, treatment method, and experimental conditions used in this experiment and cannot be directly extrapolated to other fish, shrimp, snails, or other aquatic organisms.
In summary, under the conditions of this experiment, black beard algae showed obvious whitening, yellowing, and death at nominal treatment concentrations of 4–5 ppm, with approximately 4 ppm serving as a reference concentration at which obvious death began. However, because concentrations of 3 ppm and above had already caused obvious damage to Vallisneria, this experiment did not obtain an ideal concentration that simultaneously balanced clear algae removal efficacy and the safety of all tested aquatic plants.
When using glutaraldehyde to control black beard algae in actual practice, decisions should be made according to the aquatic plant species present in the tank and their tolerance. The concentration required to kill black beard algae should not be used alone as the whole-tank application concentration.
References
[1] ZHAN S H, HSIEH T Y, YEH L W, et al. Hidden introductions of freshwater red algae via the aquarium trade exposed by DNA barcodes[J]. Environmental DNA, 2021, 3(2): 481–491. DOI:10.1002/edn3.139.
[2] SANO L L, KRUEGER A M, LANDRUM P F. Chronic toxicity of glutaraldehyde: differential sensitivity of three freshwater organisms[J]. Aquatic Toxicology, 2005, 71(3): 283–296. DOI:10.1016/j.aquatox.2004.12.001.
[3] PEREIRA S P P, OLIVEIRA R, COELHO S, et al. From sub cellular to community level: toxicity of glutaraldehyde to several aquatic organisms[J]. Science of the Total Environment, 2014, 470–471: 147–158. DOI:10.1016/j.scitotenv.2013.09.054.
[4] LEUNG H W. Ecotoxicology of glutaraldehyde: review of environmental fate and effects studies[J]. Ecotoxicology and Environmental Safety, 2001, 49(1): 26–39. DOI:10.1006/eesa.2000.2031.
[5] MIGNEAULT I, DARTIGUENAVE C, BERTRAND M J, et al. Glutaraldehyde: behavior in aqueous solution, reaction with proteins, and application to enzyme crosslinking[J]. BioTechniques, 2004, 37(5): 790–802. DOI:10.2144/04375RV01.